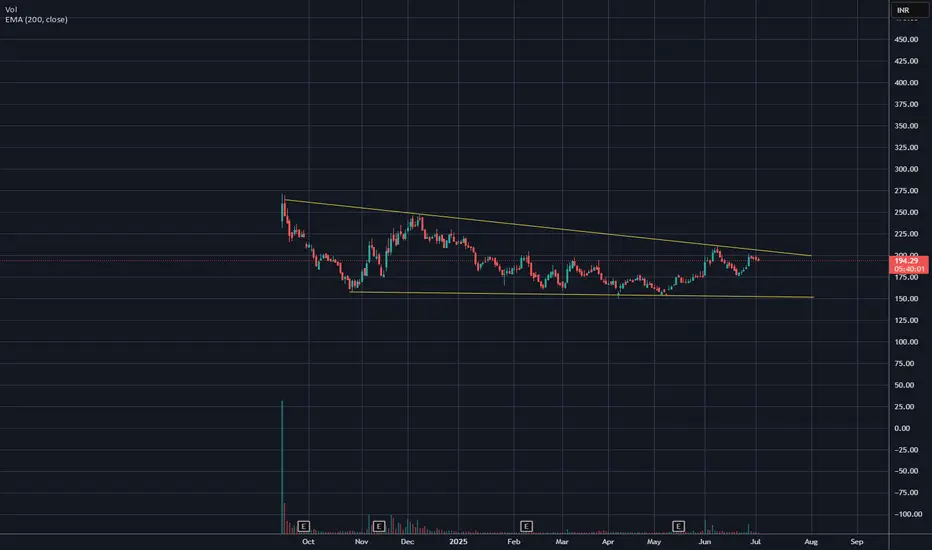
MANGCHEFER - Bullish PennantMangalore Chemicals & Fertilizers Ltd.
Forming a Bullish Pennant in Daily timeframe.
Within 52 week high zone.
Within all time high zone.
Outperforming Stock.
Disclaimer:
For educational purpose only.
Please do your own research before taking any trades.
Happy Trading!

Buy Hdfclife insurance perfect Target 876Everything mention about in my chart
Technically very strong confirmation
Technical 3 indicator
1st indicator channel flying price 769
2nd indicator filag price 788
3rd Elliott wave target 876
small stoploss 801 day closing
conclusion ; I am not sebi reg Not recommendation to buy this is my own idea only,,
Happy trade
Regards,
Vishnu barath (Tamil Nadu)

EICHERMOT : Elliott Wave FormationElliott Wave Formation: Wave 3 is getting formed, which is the largest swing in the Elliott wave.
Try to ride as far as possible.
Wave 3 Vertical length=1.618× Wave 1 Vertical length
Target = ~6500

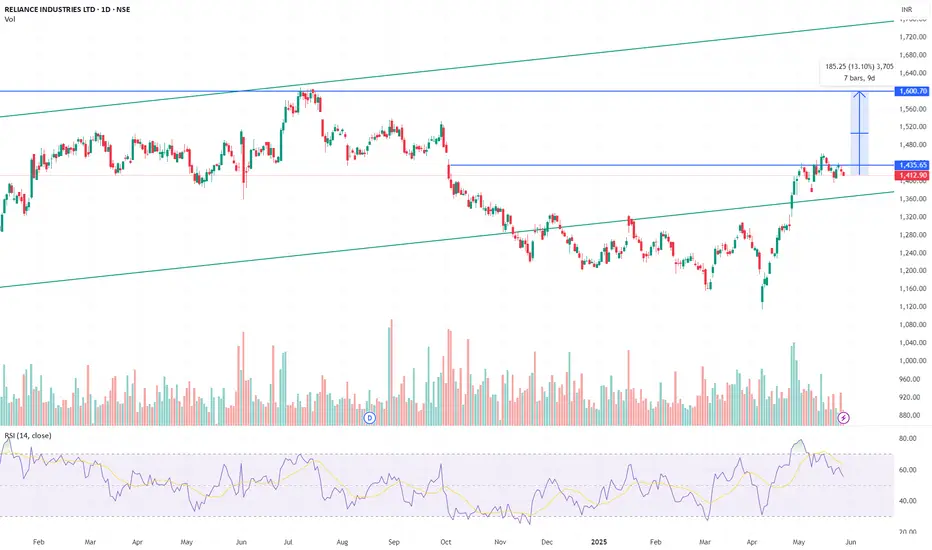
RELIANCE: Strong Resistance at ₹1600 — Covered Call Setup📉 Chart Context:
Reliance recently rallied ~25% from lows near ₹1,150 to ₹1,450.
The rally stalled at the broken lower trendline of a long-term channel, turning resistance.
Price action now showing rejection around ₹1,435–₹1,450 zone — a historical supply area.
📊 Derivatives Insight:
July ₹1600 CE has the highest Open Interest across the chain: 3.6 lakh+ contracts.
This strike acts as a clear ceiling for market participants.
IV for ₹1600 CE is elevated at 21.8%, indicating overpricing of far OTM risk.
📈 Strategy:
Strategy Bias: Neutral / Mildly Bearish
⚠️ Note: This strategy is suitable only for investors already holding a sizeable position (≥500 shares) in Reliance. It is not a recommendation to buy the stock solely for option writing.
With 500+ shares held, this aligns perfectly for a covered call:
Sell July ₹1600 CE at ₹7.20
Generate passive income (~₹3,600/lot) while capping gains ~13% above CMP
Play on sideways or weakening structure without exiting core position
⚠️ Risk Management:
If Reliance breaches ₹1600 before expiry, gains above this are capped
Position sizing and pledge margin must be managed correctly
📌 Conclusion:
This is a textbook low-risk income strategy using technical resistance, OI data, and IV edge. Unless a fresh breakout emerges, ₹1600 stands firm.
Disclaimer: T his analysis is for educational and informational purposes only. It does not constitute investment advice or a recommendation. Options trading involves risk. Always do your own research or consult a financial advisor before making decisions.
Review and plan for 2nd July 2025 Nifty future and banknifty future analysis and intraday plan.
Swing idea.
This video is for information/education purpose only. you are 100% responsible for any actions you take by reading/viewing this post.
please consult your financial advisor before taking any action.
----Vinaykumar hiremath, CMT

BHARAT ELECTRONICS LTD – Is in Uptrend …. What NextBEL: CMP: 363.90 RSI: 80.47
BEL is consistently making new highs and is currently in a strong uptrend. The RSI indicates that the stock is in the overbought zone, following a sharp price expansion over the past week. Wave analysis suggests there is still an upside potential of 20–22% from current levels . However, some consolidation around these levels is likely in the near term. BEL could be a good trading candidate if approached with the following strategy:
Entry: 346-335
Target: 435
Stoploss: 318 (on closing basis)
✅ For more trading ideas like this, make sure to share and follow my Idea Stream! ✅

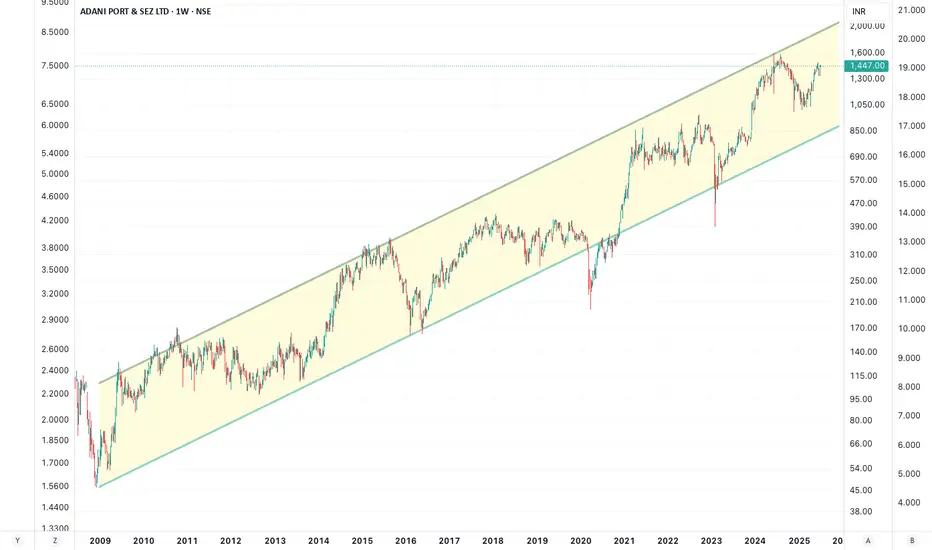
Adani PortAdani Port , 27X, CAGR 25%
16 years, consistently chugging along
Hindenburg
Hamas
Haifa
Nothing could stop this Titan.
India-Middle East-Europe Economic Corridor (IMEC) when operational will make this into a 5 lakh crore company.
ONGC BuyONGC seems to take support at its channel bottom. Buy @CMP (243.5) with SL of 240 and target of 255.

Oberoi Realty SellOberoi Realty break below its trend line. Sell @CMP (1910) with SL of 1990 and target of 1850, 1805 & 1770.

SBI Life Long_Shows StrengthSBI Life Long:
- Price Shows strength.
- Consolidated for few days & today's candle Engulfed
prior week's entire price action
- Looks good for Long in short term.
- SL: Today's Low

IDFC First Bank BuyIDFC FIrst Bank taking support at trend line. Although it is nearing a resistance line, it is likley break above as there are double test of the trend line as well as higher high and higher low formation. Buy @CMP (72) with SL of 69 and target of 75 & 85.

ICICI Prudential Life Insurance BuyICICI Prudential Life Insurance jumped back from its channel support. Also it break above its recent resistance line. Small return trade. Buy @CMP (648) with SL of 640 and target of 665 and 675. Long-term target is 730.

BHEL BuyBHEL seems to take support at channel support-line. Buy @CMP (260) with a SL of 240 and target of 265, 280 & 300

Adani Enterprise BuyJune-24, 2025
Adani Enterprise is trading in a channel as marked. The stock took support at channel bottom. Buy @CMP (2505) wth SL of 2405 and target of 2650-2700.

Divis Lab SellDivis Labarotoris breaks trend line. Sell @CMP (6590) with SL of 6703 and target of 6400


ALBERT DAVIDAlbert David Ltd. is a pharmaceutical company engaged in the manufacturing and marketing of formulations, bulk drugs, and healthcare solutions. It serves domestic and export markets with products across therapeutic areas such as gastroenterology, gynecology, and general medicine. The stock is currently trading at INR 881.55, showing signs of upward momentum following a period of consolidation.
Key Levels
Support Levels: INR 758.00, INR 970.50, INR 1,141.30
Swing Level: INR 881.55
Possible Upside: INR 1,545.65, INR 1,758.55, INR 2,027.70
Technical Indicators
RSI (Relative Strength Index): Currently at 46.17, suggesting neutral momentum. A break above the mid-50s range would confirm growing strength.
Volume: At 21.34K, the rising volume alongside recent price uptick signals early signs of accumulation and potential trend development.
Sector and Market Outlook
Albert David operates in India’s formulation-driven pharmaceutical sector, which is buoyed by:
Consistent domestic demand for generics and branded formulations
Increased R&D investments for differentiated dosage forms and APIs
Evolving export strategy amid global interest in Indian pharma suppliers
Challenges include pricing caps by regulators, raw material import reliance (especially for APIs), and generic competition from larger incumbents.
Latest Developments
Manufacturing Upgrade: Recent investments in facility modernization to meet evolving GMP standards
Product Portfolio Expansion: Strengthening presence in anti-infectives and critical care segments
Earnings Performance: Sequential growth in operating margins with a focus on efficiency and therapeutic diversification
Dividend Update
Albert David Ltd. has maintained a consistent payout strategy, most recently declaring a dividend of ₹5.00 per share, reflecting stable fundamentals and shareholder alignment.
Analysis Summary
Albert David Ltd. is exhibiting a technically constructive setup within the broader pharma space. While momentum remains neutral, increasing volume and structural stability support a positive outlook. With improving fundamentals and rising investor participation, the stock may be entering a base-building phase with scope for medium-term trend development as sector sentiment strengthens.

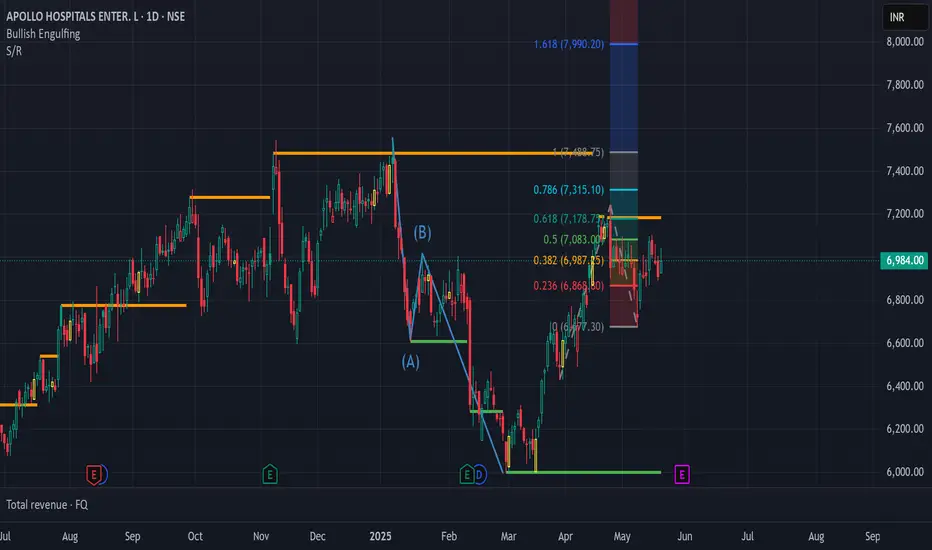
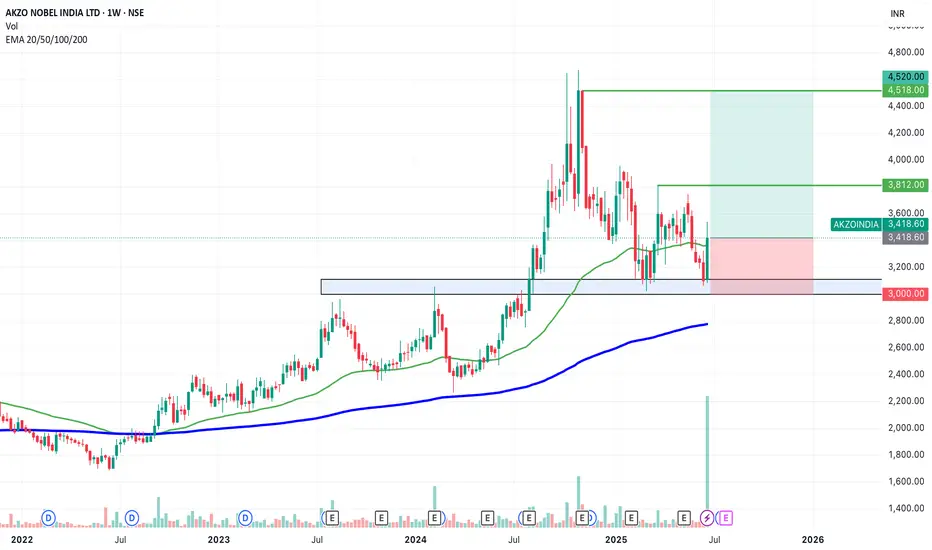
SWING IDEA - AKZO NOBEL INDIA Akzo Nobel India , a subsidiary of the global paints and coatings giant AkzoNobel N.V., is a leading player in India’s decorative and industrial paints market. Known for its premium brand Dulux , the company has strong brand recall, a wide distribution network, and consistent profitability.A strong brand, steady margins, and a bullish chart make this a candidate to watch for a short- to medium-term swing trade.
Reasons are listed below :
Bullish engulfing candle spotted on the weekly timeframe, signaling a potential trend reversal.
Accompanied by the highest-ever volume spike, adding strong conviction to the move.
Price is bouncing off the golden Fibonacci support (0.618), a classic retracement zone where strong reversals often occur.
The level of 3100 acted as a solid support.
The stock is trading above its 50 & 200 EMA on the weekly chart — a sign of long-term strength.
Target - 3812 // 4520
Stoploss - weekly close below 3000
DISCLAIMER -
Decisions to buy, sell, hold or trade in securities, commodities and other investments involve risk and are best made based on the advice of qualified financial professionals. Any trading in securities or other investments involves a risk of substantial losses. The practice of "Day Trading" involves particularly high risks and can cause you to lose substantial sums of money. Before undertaking any trading program, you should consult a qualified financial professional. Please consider carefully whether such trading is suitable for you in light of your financial condition and ability to bear financial risks. Under no circumstances shall we be liable for any loss or damage you or anyone else incurs as a result of any trading or investment activity that you or anyone else engages in based on any information or material you receive through TradingView or our services.
@visionary.growth.insights
Buy strong confirmationeverything mention about in my chart
technical strong uptrend DMART stock
buy current market price
target 4970
duration 2 weeks only
happy trade
Happy profit
conclusion; I am not sebi reg,, this is own idea,,

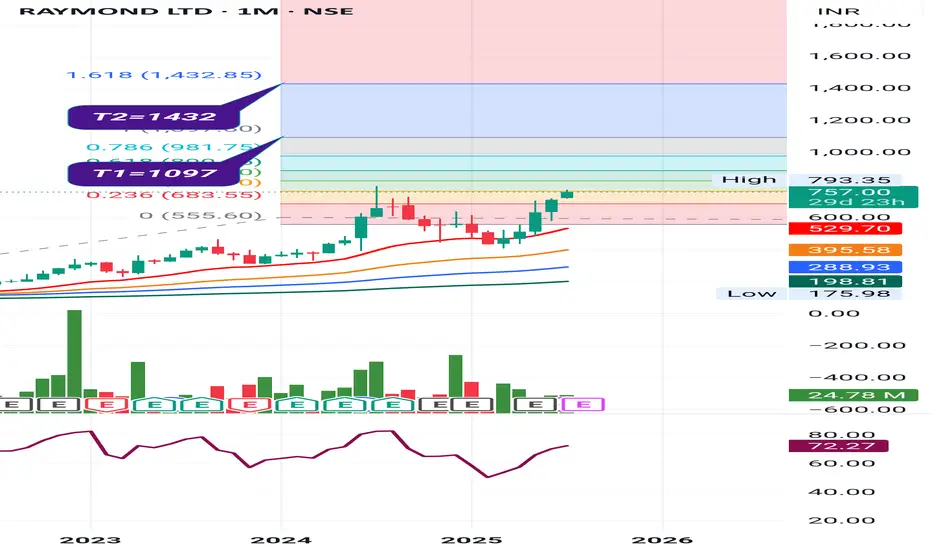
Raymond Ltd Raymond Ltd
P&F on Yearly Basis.
With BO.
EMAs: Widening gaps amongst 20/50/100/200 levels on monthly basis.
Vol. Built-up needs to be watched.
Trail SL with Upside.
Book Profit as per Risk Appetite.
This is an Opinion. Do Your Own Research as well.
Happy Investing.
Big breakout Support and resistance chart
Just for testing
Waiting for support area
Bullish move coming soon