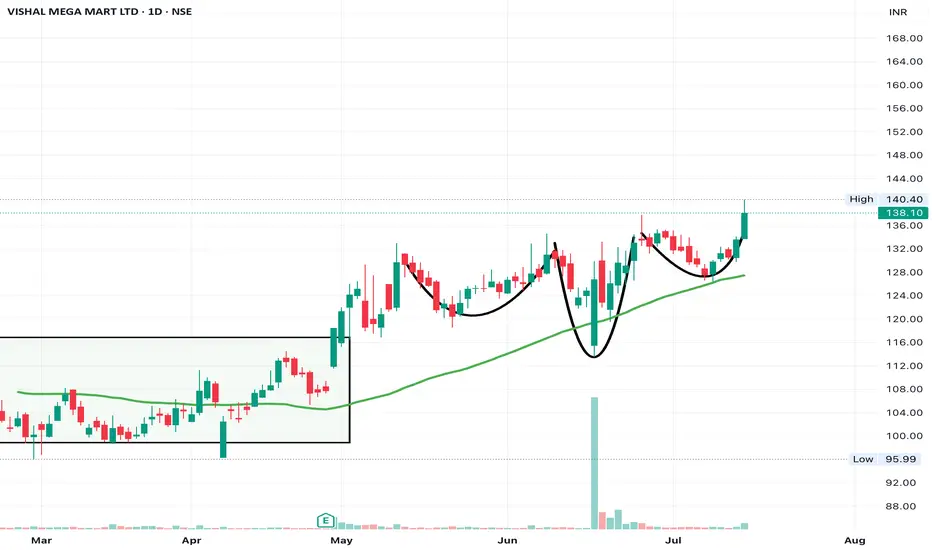
VMM - Inverse Head and Shoulder Not all charts are perfect, but in my experience, shorter the contraction duration, higher the momentum. Lets see this in action on this trade!
Breakout has happened, would love to get a close near the day high.
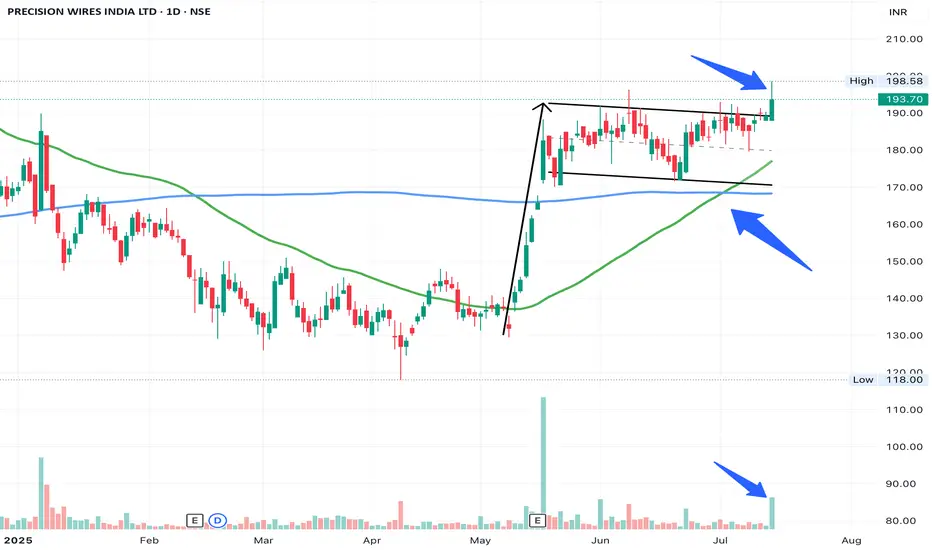
PRECWIRE - Flag and Pole BreakoutFlag and Pole Breakout (needs to sustain till EOD to confirm)
Great Relative Strength and Good volumes.
SL - 170 (partial exit can be done at 180)
Shriram financeShowing bullish signal.
But there is resistance after 8 to 9%
So define your SL before leap into it.
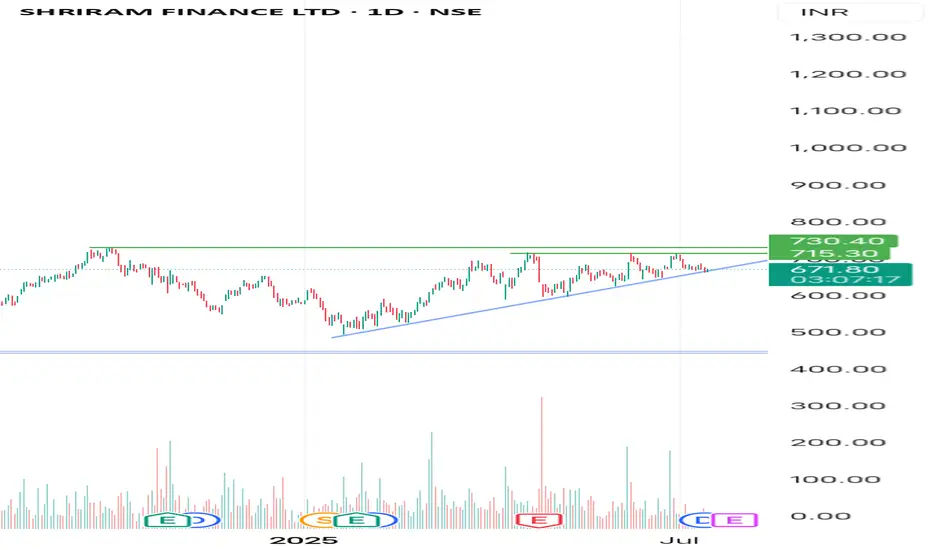

LongThis stock has broken its resistance level and trending with good volumes. We can take a swing trade in this stock with an SL of 6% and with target of 30%. Our profit and loss ratio is 1:5.
Points to remember:
* Take trade at current CMP.
* SL at point 1065.
* Target at point 1480.
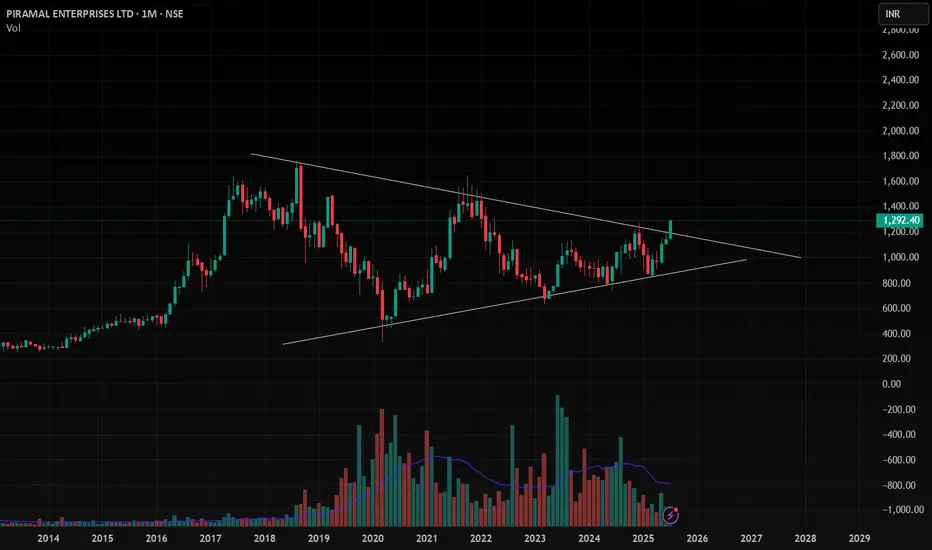
PEL , 1M , BullishThe Triangle Pattern is Breaking Out in Monthly Time Wait for Strong and Perfect close in Weekly Time and Enter after Confirmation .
Take Risk According to your capital
Follow for more ideas like this
PFC– At Resistance with Ascending Triangle PatternPower Finance Corporation (NSE: PFC) is forming a technically clean structure — trading within a rising trend channel and now testing a critical resistance zone around ₹430–₹440.
This is a make-or-break level, and the market could tip in either direction depending on how price reacts this week.
1. Chart Structure Overview
Support Zone: Defined by a rising green trendline connecting higher lows since March 2025.
Resistance Zone: Red band between ₹430–₹440, where price has previously reversed multiple times.
200 EMA (Blue Line): Currently hovering around ₹423, adding confluence as a dynamic support/resistance level.
This convergence makes the current price zone crucial for directional confirmation.
2. Two Trade Scenarios
Scenario 1: Bullish Breakout (Trend Continuation)
If the price breaks above ₹440 with strong bullish candles, traders can look for:
✅ Entry after a confirmed breakout + re-test of the ₹430–₹435 zone
🎯 Target Zones: ₹455, ₹470+
🛡️ Stop Loss: Below the swing low of the re-test (₹425 or as per price structure)
🔁 Risk/Reward: 1:2 or better
Scenario 2: Resistance Rejection (Short-Term Pullback)
If the price fails to break above ₹430–₹440 and shows reversal patterns:
✅ Entry on confirmation (e.g., bearish engulfing, rejection wick)
🎯 Target Zones: ₹410 (near rising trendline), possible extension to ₹400
🛡️ Stop Loss: Just above the resistance (~₹442–₹445)
🔁 Risk/Reward: 1:2 to 1:3 depending on entry
Thread>

#DIXON - 4000 Pts move coming? 18246 or 9842.00?Date: 24-05-2025
#Dixon
Current Price: 14473
Pivot Point: 14044.00 Support: 13213.60 Resistance: 14882.04
Upside Targets:
Target 1: 15991.02
Target 2: 17100.00
Target 3: 18246.00
Target 4: 19392.00
Downside Targets:
Target 1: 12100.80
Target 2: 10988.00
Target 3: 9842.00
Target 4: 8696.00

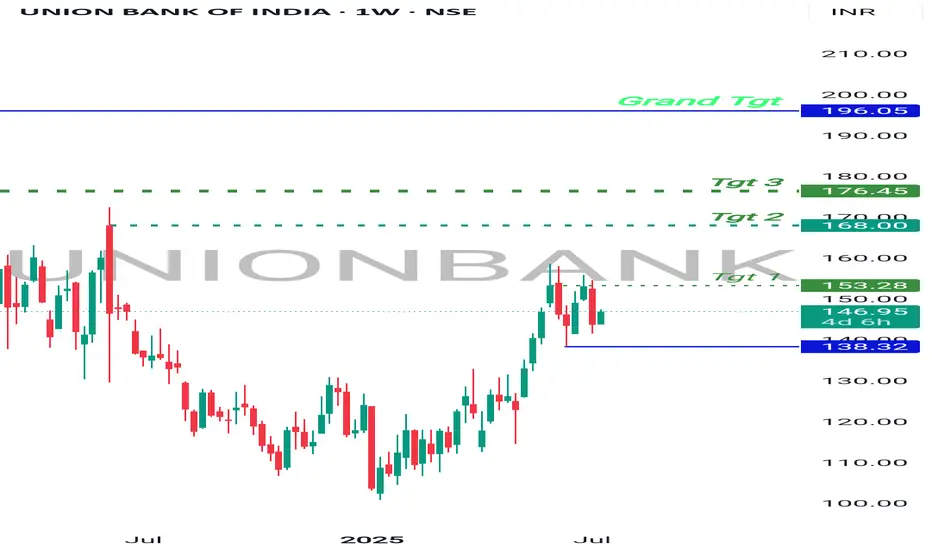
Bullish Bet , UnionBankBanknifty at support.
UnionBank on recent high making sideways moves, which means consolidation.
Once Banknifty Bounce back, UnionBank will break the resistance on weekly and monthly Basis and will start moving higher.
It has higher targets on a short and long term investment.
Good to hold for short term.
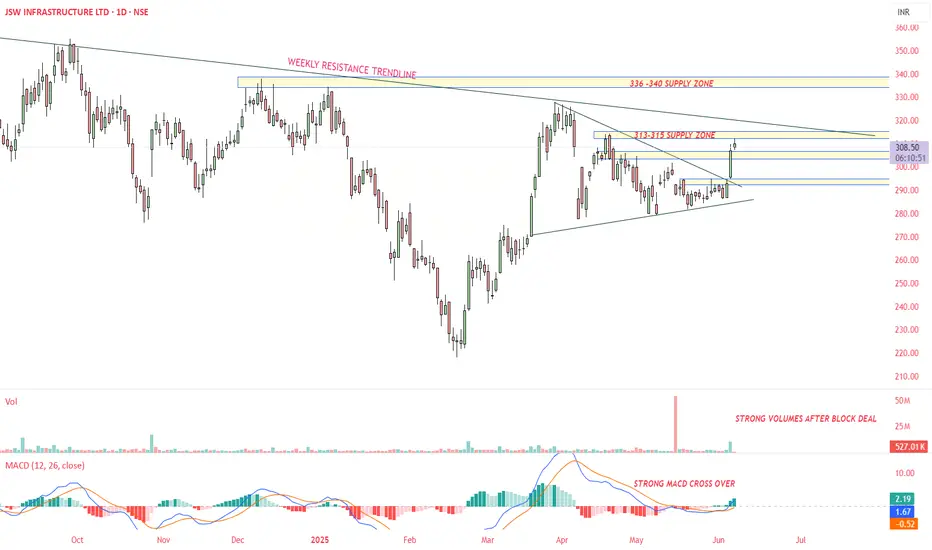
JSWINFRA - Daily time frame StudyFollowing are my Inputs for above chart reading -
1. MACD cross over
2. High volume Breakout of Symmetrical Triangle Pattern - Daily Time frame
3. It may go till weekly resistance line 330-340
This chart is only for educational purpose, Please contact your financial advisor for any trading or investment decisions.
NAVINFLOUR BROKEN ATHNavin flour has broken ATH and looks like a rounding bottom
with very minimum risk with stop of close below 4800 one can go long with target of 6800


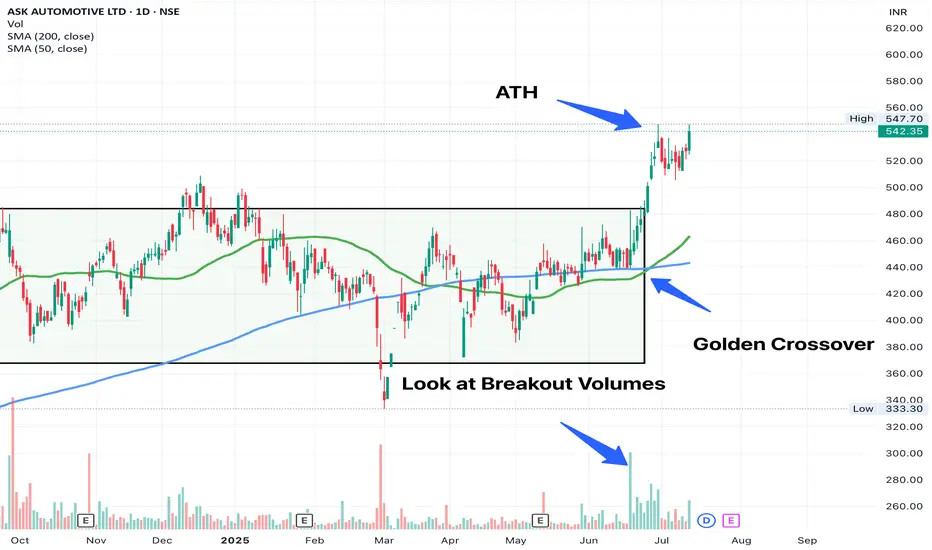
ASKAUTOLTD - Strong Technicals + Strong Fundamentals Should be a long term play, looks strong from the medium term. Beautiful Chart. MCap less than 10K Cr, poised for growth, strong fundamentals, strong technicals.
How to build Positions - Gradual scale in is your answer. Do not put in money blindly at open, good thinks take time to build and so should your portfolio.
SL - 480 (roughly 11% away, slow accumulation should help get your average price less than 7% away from this SL)
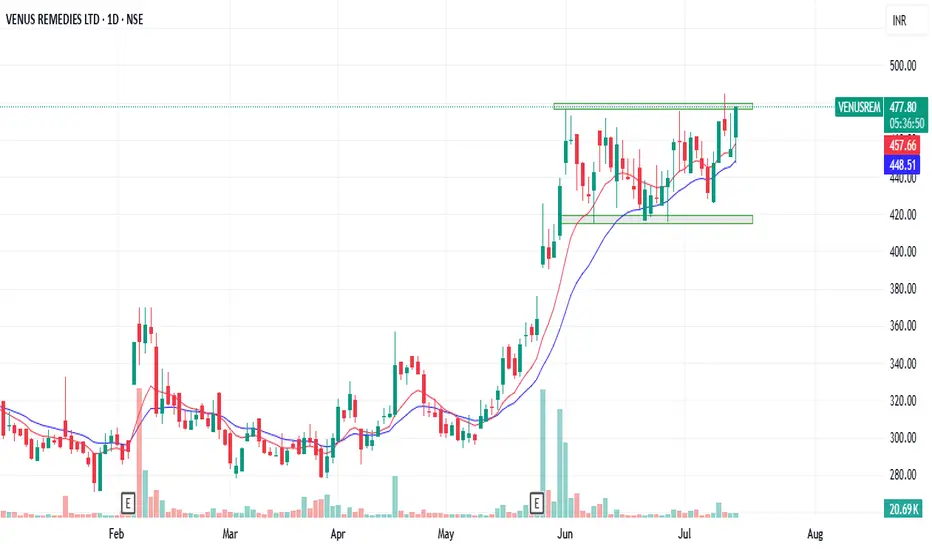
LTFOODS - Golden Crossover Golden Crossover and a new ATH. Simple things can make you money. You don't need fancy indicators for it. Most will ignore a simple template, but those who see the beauty will mint.
SL: 441 (Low of Breakout Candle)

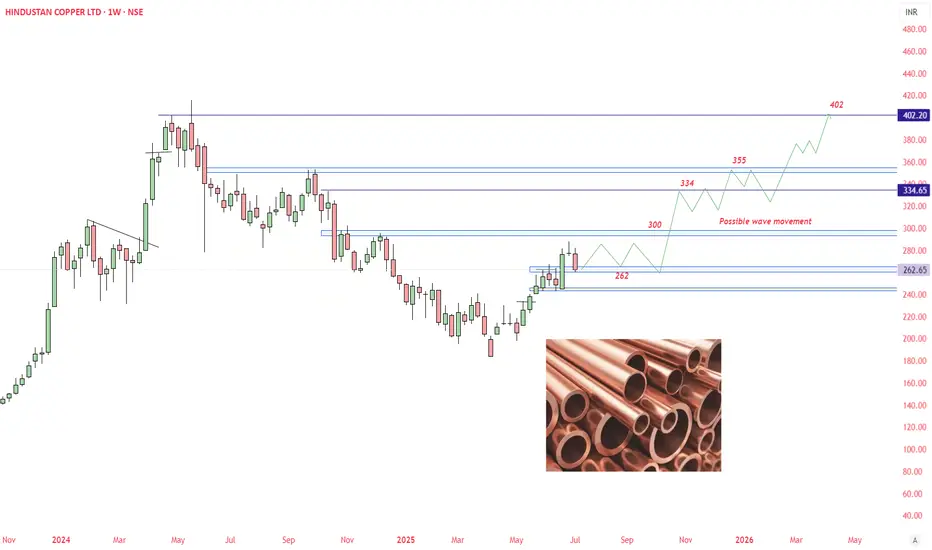
HINDUSTAN COPPER - A bullish viewLooking at copper demand in upcoming years, Bullish view are created for Hindustan copper. I have marked a wave movement that may happen during coming years.
This chart is only educational purpose. Do your own study before taking any trade or financial decisions.
Capri Global📈 Trade Plan
Action: ✅ BUY
Entry Point: ₹136
Stop Loss (SL): ₹119
Target (TGT): ₹437
Risk: ₹17
Reward: ₹301
Risk-Reward Ratio (RRR): 🔥 17.7 — Excellent
📊 Key Levels
Parameter Value
Last High ₹289
Last Low ₹141
Point Variation ₹148
🔍 Interpretation & Strategy
All trends align UP, showing strong bullishness across timeframes.
Demand zones are tightly packed (119–136) → Indicates strong institutional buying base.
Entry at demand base gives excellent RRR.
Target of ₹437 may seem far, but is structurally feasible if broader market supports and breakout holds post ₹289 (previous high).
SL at ₹119 protects capital well below the demand zone.
✅ Recommendation
A textbook HTF Demand Zone Buy Setup.
Can consider partial booking near previous high (₹289) and trail the rest toward final target.
Ensure to review volume confirmation at demand zone before entering.
🧾 Multi-Timeframe (MTF) Analysis Summary
Overall Trend: 🔼 Strong UPTREND across all timeframes
Demand Zone: Consistent at 136 (Proximal) to 119 (Distal) across HTF, MTF, and ITF
Logic Used:
HTF: Rally-Rally / Rally-Base-Rally
MTF & ITF: BUFL / DMIP (signs of strong continuation demand)

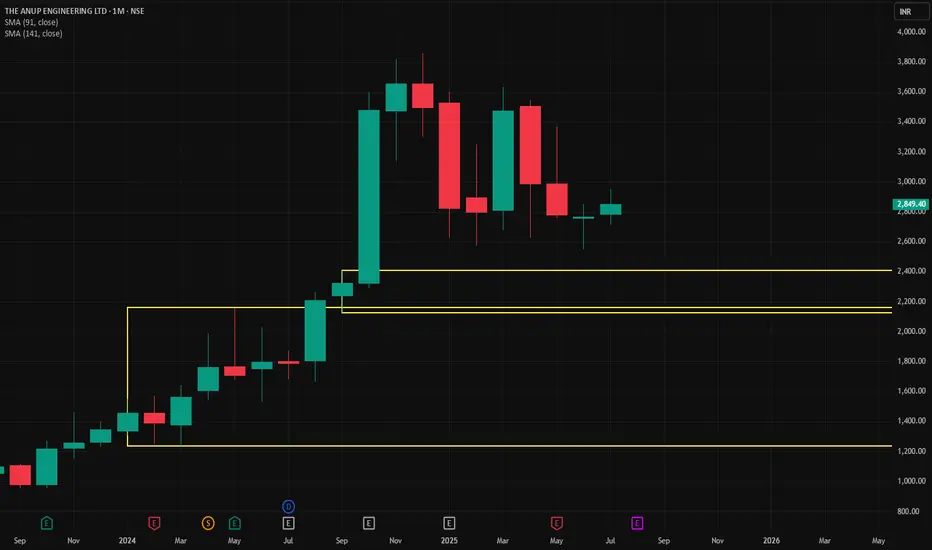
Anup Engg📈 Trade Plan:
Entry-1: ₹2408
Stop Loss: ₹2308
Risk: ₹100
Reward: ₹3017
Target: ₹5425
Risk:Reward (RR): 30.2 — extremely favorable if it plays out
Last High: ₹3859
Last Low: ₹2293
Point Variance: 1566
✅ Interpretation & Insights:
Trend Confirmation Across All Timeframes:
Every timeframe from yearly down to intraday (60M) shows an uptrend, indicating strong bullish momentum and confirmation across multiple investor classes.
Demand Zone Clustering:
The demand cluster around 2288–2408 is repeated across MTF & ITF zones. This tight range is a strong accumulation zone.
You are entering right at the upper edge of the demand, which is okay, but better RR existed slightly lower.
Trade Setup:
Entry: ₹2408 is aligned with the weekly/monthly proximal zone.
SL: ₹2308 is just below the demand zone, which is valid technically.
Target: ₹5425 seems based on projection logic (perhaps supply zone or fib extensions). It’s aggressive, but technically aligned with the broader HTF trend.
Risk-Reward:
RR of 30.2 is theoretically excellent, but practically it suggests your SL is very tight compared to the move expected. Monitor volatility closely.
🧠 Strategic Suggestions:
If price consolidates above ₹2408 and shows strength, consider pyramiding.
Watch for daily close above ₹2408 to confirm institutional interest.
Trail SL aggressively once above ₹3000 to protect profit.
🔍 Multi-Timeframe (MTF) Trend Summary:
Timeframe Trend Demand Zone (Proximal–Distal) Avg
Yearly UP 1459 – 1236 1348
Half-Yearly UP 2160 – 1665 1913
Quarterly UP 2160 – 1665 1913
HTF Avg UP 1926 – 1522 1724
| Monthly | UP | 2408 – 2125 | 2267 |
| Weekly | UP | 2408 – 2125 | 2267 |
| Daily | UP | 2395 – 2288 | 2342 |
| MTF Avg | UP | 2404 – 2179 | 2292 |
| 240M | UP | 2395 – 2288 | 2342 |
| 180M | UP | 2395 – 2288 | 2342 |
| 60M | UP | 2337 – 2308 | 2323 |
| ITF Avg | UP | 2376 – 2295 | 2335 |
Glenmark Pharma – Historic 16-Year Cup & Handle Breakout!Glenmark has completed a massive Cup and Handle pattern after nearly 16 years, breaking past its 2008 all-time high with a powerful volume spike. This is a textbook long-term breakout, potentially signaling the start of a major multi-year bullish trend in the pharma sector.

PARAS DEFENSE📈 Trade Setup
Parameter Value
Buy Entry ₹738
Stop Loss (SL) ₹670
Target ₹1,194
Risk ₹68
Reward ₹456
Risk:Reward 6.7 : 1
Last High: ₹797 — Once broken, can trigger fresh momentum.
Last Low: ₹400 — Previous strong base.
⚠️ Key Observations
Strong Weekly & Daily Demand just below current price (678–738) supports the buy zone.
Entry near BUFL zone → suggests breakout continuation.
High reward-to-risk ratio (6.7x) → Attractive setup.
If ₹797 (previous high) breaks with volume, the rally may accelerate toward ₹1,000+.
📌 Strategy
Entry: On price stability above ₹738 or on intraday retest with confirmation.
SL Discipline: Maintain tight SL at ₹670 (just below multiple demand zones).
Partial Booking: Consider at ₹900–950 before full target if volatility spikes.
🔍 Trend Overview
Timeframe Trend Demand Zone Avg Price
HTF (Yearly–Quarterly) UP 302–587 407
MTF (Daily–Monthly) UP 404–738 620
ITF (60M–240M) UP 670–698 686

L&T Finance – Cup & Handle Breakout After 8 Years!L&T Finance has finally broken out of a classic Cup and Handle pattern, reclaiming its 2017 all-time high after nearly 8 years of consolidation. Strong volume confirmation adds weight to this long-term bullish breakout. A must-watch for positional traders and investors looking for momentum in the NBFC space!

Pondy Oxide, Kindly do your own studyThis stock is in momentum in weekly time frame.
Monthly time frame- stock has completed 4 wave structure and looks like its in 5th wave.
Weekly-stock has challenged upper bollinger band
Weekly MACD -PCO stat
Weekly RSI is in momentum
Weekly ADX is strong
Daily price is in momentum and volume has increased
