Divis Lab SellDivis Labarotoris breaks trend line. Sell @CMP (6590) with SL of 6703 and target of 6400


ALBERT DAVIDAlbert David Ltd. is a pharmaceutical company engaged in the manufacturing and marketing of formulations, bulk drugs, and healthcare solutions. It serves domestic and export markets with products across therapeutic areas such as gastroenterology, gynecology, and general medicine. The stock is currently trading at INR 881.55, showing signs of upward momentum following a period of consolidation.
Key Levels
Support Levels: INR 758.00, INR 970.50, INR 1,141.30
Swing Level: INR 881.55
Possible Upside: INR 1,545.65, INR 1,758.55, INR 2,027.70
Technical Indicators
RSI (Relative Strength Index): Currently at 46.17, suggesting neutral momentum. A break above the mid-50s range would confirm growing strength.
Volume: At 21.34K, the rising volume alongside recent price uptick signals early signs of accumulation and potential trend development.
Sector and Market Outlook
Albert David operates in India’s formulation-driven pharmaceutical sector, which is buoyed by:
Consistent domestic demand for generics and branded formulations
Increased R&D investments for differentiated dosage forms and APIs
Evolving export strategy amid global interest in Indian pharma suppliers
Challenges include pricing caps by regulators, raw material import reliance (especially for APIs), and generic competition from larger incumbents.
Latest Developments
Manufacturing Upgrade: Recent investments in facility modernization to meet evolving GMP standards
Product Portfolio Expansion: Strengthening presence in anti-infectives and critical care segments
Earnings Performance: Sequential growth in operating margins with a focus on efficiency and therapeutic diversification
Dividend Update
Albert David Ltd. has maintained a consistent payout strategy, most recently declaring a dividend of ₹5.00 per share, reflecting stable fundamentals and shareholder alignment.
Analysis Summary
Albert David Ltd. is exhibiting a technically constructive setup within the broader pharma space. While momentum remains neutral, increasing volume and structural stability support a positive outlook. With improving fundamentals and rising investor participation, the stock may be entering a base-building phase with scope for medium-term trend development as sector sentiment strengthens.

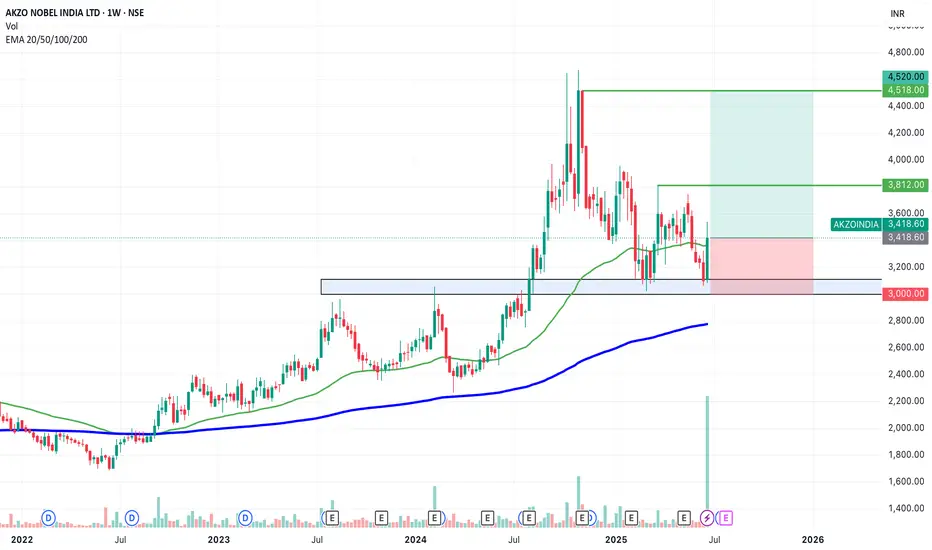
SWING IDEA - AKZO NOBEL INDIA Akzo Nobel India , a subsidiary of the global paints and coatings giant AkzoNobel N.V., is a leading player in India’s decorative and industrial paints market. Known for its premium brand Dulux , the company has strong brand recall, a wide distribution network, and consistent profitability.A strong brand, steady margins, and a bullish chart make this a candidate to watch for a short- to medium-term swing trade.
Reasons are listed below :
Bullish engulfing candle spotted on the weekly timeframe, signaling a potential trend reversal.
Accompanied by the highest-ever volume spike, adding strong conviction to the move.
Price is bouncing off the golden Fibonacci support (0.618), a classic retracement zone where strong reversals often occur.
The level of 3100 acted as a solid support.
The stock is trading above its 50 & 200 EMA on the weekly chart — a sign of long-term strength.
Target - 3812 // 4520
Stoploss - weekly close below 3000
DISCLAIMER -
Decisions to buy, sell, hold or trade in securities, commodities and other investments involve risk and are best made based on the advice of qualified financial professionals. Any trading in securities or other investments involves a risk of substantial losses. The practice of "Day Trading" involves particularly high risks and can cause you to lose substantial sums of money. Before undertaking any trading program, you should consult a qualified financial professional. Please consider carefully whether such trading is suitable for you in light of your financial condition and ability to bear financial risks. Under no circumstances shall we be liable for any loss or damage you or anyone else incurs as a result of any trading or investment activity that you or anyone else engages in based on any information or material you receive through TradingView or our services.
@visionary.growth.insights
Buy strong confirmationeverything mention about in my chart
technical strong uptrend DMART stock
buy current market price
target 4970
duration 2 weeks only
happy trade
Happy profit
conclusion; I am not sebi reg,, this is own idea,,

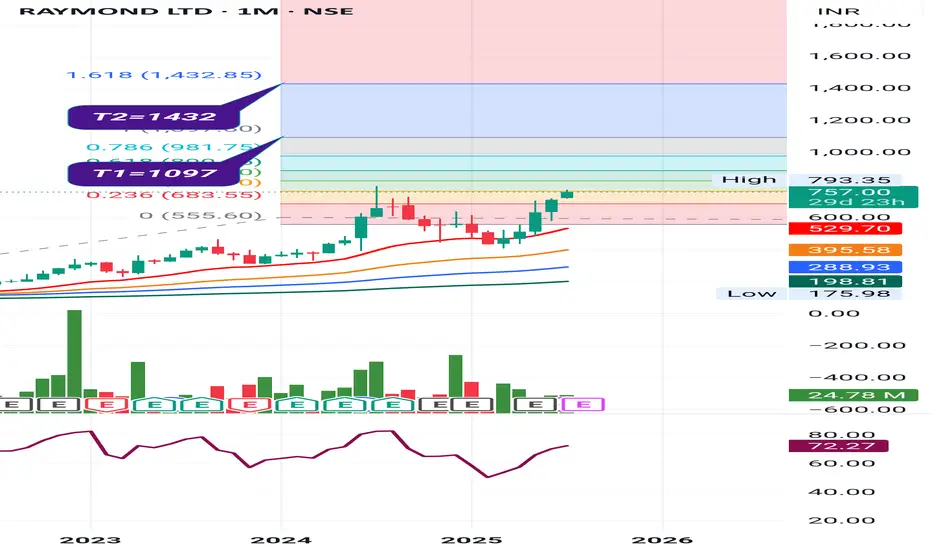
Raymond Ltd Raymond Ltd
P&F on Yearly Basis.
With BO.
EMAs: Widening gaps amongst 20/50/100/200 levels on monthly basis.
Vol. Built-up needs to be watched.
Trail SL with Upside.
Book Profit as per Risk Appetite.
This is an Opinion. Do Your Own Research as well.
Happy Investing.
Big breakout Support and resistance chart
Just for testing
Waiting for support area
Bullish move coming soon

Jai corporation long Jai corporation is in consolidation mode, but it's my view that very soon it may start it's upward movement towards it's high. Please research your own.

clsel buy @ 380 , target 4000 .Chaman Lal Setia Exports Ltd. (CLSEL):
NSE:CLSEL | Patience = Wealth 🥇🌾
🔁 Cup Bottom Structure forming beautifully
🛒 Accumulate @ ₹370–390
🎯 Target ₹4000 in 8 years
India’s top Basmati rice exporter—this can be the next KRBL-level wealth compounder.
#CLSEL #RiceExports #LongTermWealth #UniproMomentumPattern #NSEStocks #InvestingIndia

SBIN | Buy @LTP | SL below 776 | Targets 880, 970Disclaimer:
This is not financial advice. Please do your own research or consult with a financial advisor before making any investment decisions. Investments in stocks can be risky and may result in loss of capital.

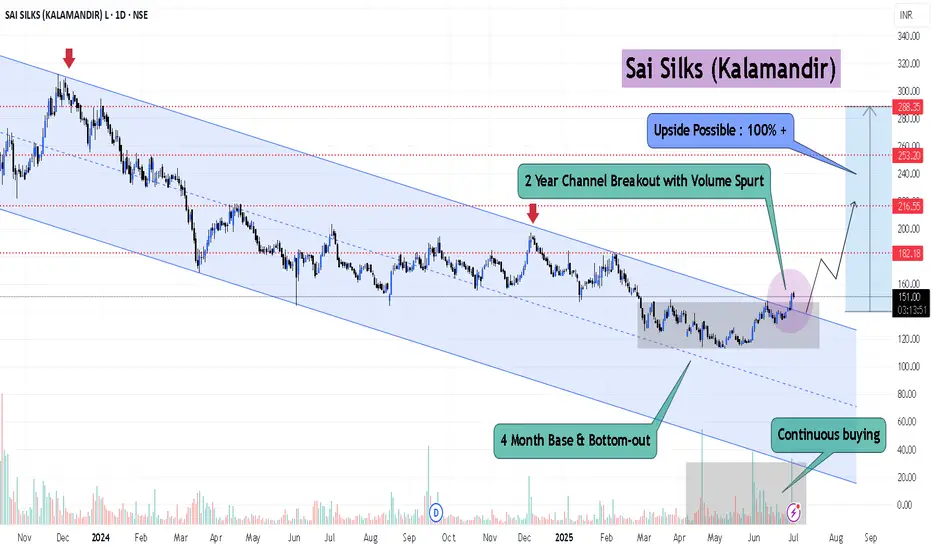
Sai Silk Potential Upside 70-100%- 2 Year Channel Breakout
- 4 Month Base & Bottom-out
Like & Boost are highly appreciable
Buy IOC short term target 155, 165 & Medium Term tgt 185, 250 Indian Oil Corporation does business in the entire hydrocarbon value chain - from Refining, Pipeline transportation and marketing of Petroleum products to R&D, Exploration & production, marketing of natural gas and petrochemicals. It has the leadership position in the Oil refining & petroleum marketing sector of India.
The company aims to strengthen EV mobility infrastructure by setting up charging points and battery-swapping facilities at its fuel stations. It has also signed a binding term sheet with Panasonic Group to form a JV for manufacturing cells in India.
The company’s R&D is focused on emerging fields such as nanotechnology, Solar, Bioenergy, Hydrogen, etc. It has an effective patent portfolio of 1636. It spent Rs 946 Cr in FY24 on R&D.
The company’s R&D is focused on emerging fields such as nanotechnology, Solar, Bioenergy, Hydrogen, etc. It has an effective patent portfolio of 1636. It spent Rs 946 Cr in FY24 on R&D.
Market Cap ₹ 2,07,370 Cr.
Annual Sales - ₹ 758,106 Cr
Dividend Yield - 8.20 %
Stock P/E - 17.0
Industry PE - 29.2
Debt to equity - 0.82
ROCE - 7.37 %
EPS - ₹ 9.63
Fundamentally, this big company is trading at a very low valuation. The Crude Oil price is expected this year to be on lowest, so we can expect good profit margin and this company is into green energy business so it should have PE multiple of that business as well. We Expect growth in EPS by 30% to 12.5 And re-rating of PE multiple to 20 so that give the share price to ₹ 250 which gives return of 70.88% from current price level of 146.30.
Technically, this is very bullish on weekly, daily timeframe. Price is trading above all short term, medium term averages. It has formed a bullish candlestick pattern on daily and weekly chart, so we expect immediate strong upside to 155, 165 and eventually 185 level and investment target of 250 levels.

HAL: fake breakdown and a possible bullish move.Stock: Hindustan Aeronautics Ltd NSE:HAL
• Timeframe: 1-day candles (each candle represents one day of trading)
1. Consolidation Zone: A grey rectangular box highlights an area of "consolidation" starting from around May 14th. This means the stock price has been trading sideways within a relatively narrow range, not showing a clear uptrend or downtrend.
2. Fake Breakdown: An arrow points to a price dip below the lower boundary of the consolidation zone. The annotation calls this a "fake breakdown." This implies that the price temporarily moved below the support level, but then quickly bounced back up.
3. Potential Trade Setup: The chart suggests a potential long (buy) trade based on the fake breakdown and the subsequent recovery.
• Entry Point: Around 4,897.55 (labeled "ENTRY" on the chart) which is the price at which the stock could be bought.
• Stop Loss: Around 4,733.75 (likely intended to be the "4733.60")
This is the level below which the trader would exit the position to limit potential losses if the price moves against them.
• Targets: The chart identifies three potential profit targets:
* Target 1: 5,087.85
* Target 2: 5,305.15
* Target 3: 5,497.80

Deepak Fertilisers- mera Ghar kaa DEEP!!📊 Summary:
Deepak Fertilizers has successfully broken out of a Cup and Handle pattern with a weekly close above ₹1450, confirming a strong bullish trend. RSI supports the move, and price action aligns with classic breakout behavior.
🔍 Technical Breakdown:
Pattern: Cup & Handle formation – bullish continuation setup.
Breakout Zone: ₹1450 breached on weekly closing basis.
Stoploss: Revised to ₹1414 (recent swing low and pattern base).
Immediate Resistance: ₹1637 (recent high – minor resistance).
Next Target Zone: ₹1750–₹1850 (based on cup depth projection and pattern breakout).
RSI (14): 69.17 – just below overbought zone, strong momentum.
Volume: 1.24M – confirms breakout strength with good participation.
✅ Suggestions:
Trend Confirmation: Weekly close above ₹1450 = Confirmed uptrend.
Buy on Dips: Any retest toward ₹1450–₹1475 could be a good entry zone.
Short-Term Targets: ₹1650–₹1700
Medium-Term Targets: ₹1800–₹2000 (Cup & Handle measured move)
Stoploss (Trailing): ₹1414 (weekly close basis) – can be revised higher as price progresses.
RSI Alert: Watch if RSI crosses into 70–75 zone – that may signal potential overbought conditions; partial profit booking advised.
⚠️ Caution:
After a sharp breakout, minor pullbacks are natural – don’t panic on short-term dips.
Avoid chasing the price – wait for consolidation or minor retracement to enter.
📌 Conclusion:
Deepak Fertilizers has entered a strong bullish phase post a confirmed Cup and Handle breakout. Momentum is healthy, supported by volume and RSI. Maintain a bullish stance with a trailing stop below ₹1414, and ride the trend toward ₹1750+ over the coming months.

MIDHANI READY TO GOMisra Dhatu Nigam Limited, it has completed its setup and ready to go above this orange line.
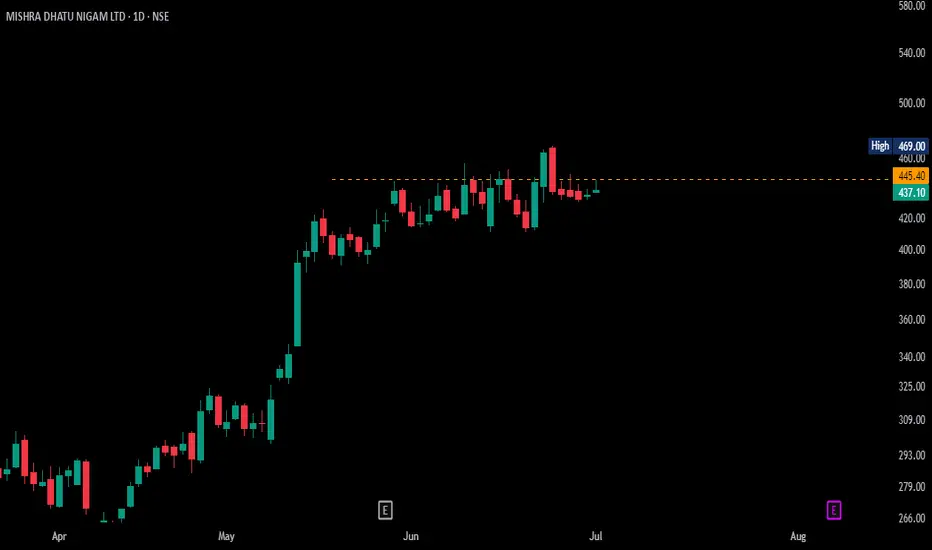
should move to 220+based on the horizontal support for descending triangle with upward trend continuation, the pattern should breakout anytime for brisk move to the target.

HYUNDAIHYUNDAI
watch above levels. green line is our entry, redline is our SL.
DISCLAIMER : I am NOT a SEBI registered advisor or a financial adviser. All the views are for educational purpose only.
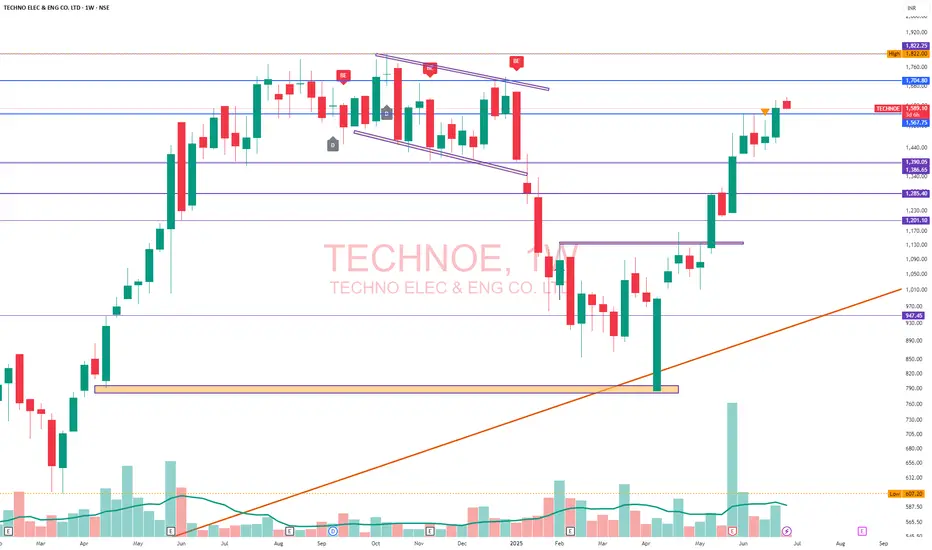
TECHNOE-1Techno Electric is looking good for swing target CMP: 1587 around.
Time: Few weeks.
Stop Loss: 1567
Target: 1600, 1650, 1700, 1750 points can be earned!