
GILLETTE : Took a long position with 1% riskEntered right after the close of the momentum candle that broke the ATH levels. Sl is kept underneath the most recent low. Will be managing the trade depending on the momentum of the market in the coming days.
📢📢📢
If my perspective changes or if I gather additional fundamental data that influences my views, I will provide updates accordingly.
Thank you for following along with this journey, and I remain committed to sharing insights and updates as my trading strategy evolves. As always, please feel free to reach out with any questions or comments.
Other posts related to this particular position and scrip, if any, will be attached underneath. Do check those out too.
Disclaimer : The analysis shared here is for informational purposes only and should not be considered as financial advice. Trading in all markets carries inherent risks, and past performance is not indicative of future results. It’s essential to conduct your own research and assess your risk tolerance before making any investment decisions. The views expressed in this analysis are solely mine. It’s important to note that I am not a SEBI registered analyst, so the analysis provided does not constitute formal investment advice under SEBI regulations.

Paytm going to boom like Zomotoyes, as per my analaysis paytm frnd of zomoto company going to boom as per my technical i am expecting 1950 target in comming days

$NSE:NTPC : A Powerhouse with Multibagger Potential?I’ve been reviewing NTPC Ltd ( NSE:NTPC ), India’s largest power generation company, and I see promising long-term potential as the company pivots towards cleaner energy and expands capacity to support India’s growing energy needs.
Why I See Multibagger Potential
Green energy pivot: NTPC is transforming from a thermal-heavy player to a clean energy leader — the transition opens huge long-term value.
Undemanding valuation: Despite the growth visibility, NTPC trades at reasonable PE and PB multiples, offering valuation comfort.
Policy tailwinds: Strong government focus on energy security, renewables, and electrification will continue to favor NTPC.
Execution strength: NTPC has a long history of successfully executing large-scale projects on time and within budget.
Just Accumulate near it best support Green AREA !
oNLY IN cASH
tHANKS

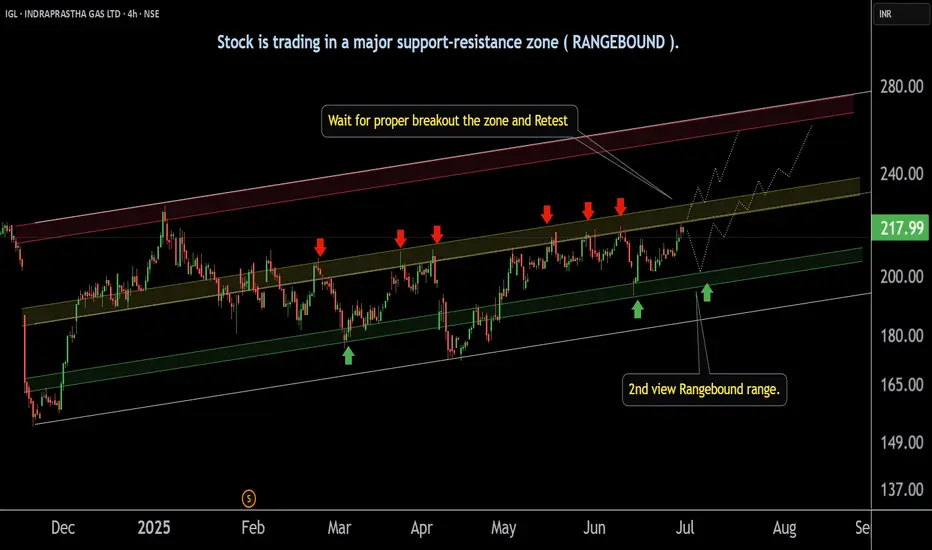
INDRAPRASTHA GAS ' s Support zone | Breakout level |This is the 4 hour chart of INDRAPRASTHA GAS .
IGL is moving in a well defined parallel channel with support range near at 195-200 level.
Igl having good law of polarity at 230 range if Igl give breakout this level and sustain above this level next resistance is near 260 and 280 .
Thank you !!
63 Moons PLAN FOR FUTURE INVESTMENTThanks for stopping by.
All analysis here is done strictly from an investor’s perspective — focusing on risk, return, valuation, and potential upside.
The notes cover key details. I’ve backed every thesis with my own analysis — no fluff, just what matters to investors.
If you find the idea useful or have suggestions, feel free to leave a comment. Always open to fresh insights.
Kind regards,
Psycho Trader

KNRCON INVESTOR'S ANALYSISThanks for stopping by.
All analysis here is done strictly from an investor’s perspective — focusing on risk, return, valuation, and potential upside.
The notes cover key details. I’ve backed every thesis with my own analysis — no fluff, just what matters to investors.
If you find the idea useful or have suggestions, feel free to leave a comment. Always open to fresh insights.
Kind regards,
Psycho Trader

PNB | Buy @110 | SL below 99 | Targets 135Disclaimer:
This is not financial advice. Please do your own research or consult with a financial advisor before making any investment decisions. Investments in stocks can be risky and may result in loss of capital.

KEI FOR FURTHER ANALYSISKEI FOR FURTHER ANALYSIS
Thanks for stopping by.
All analysis here is done strictly from an investor’s perspective — focusing on risk, return, valuation, and potential upside.
The notes cover key details. I’ve backed every thesis with my own analysis — no fluff, just what matters to investors.
If you find the idea useful or have suggestions, feel free to leave a comment. Always open to fresh insights.
Kind regards,
Psycho Trader

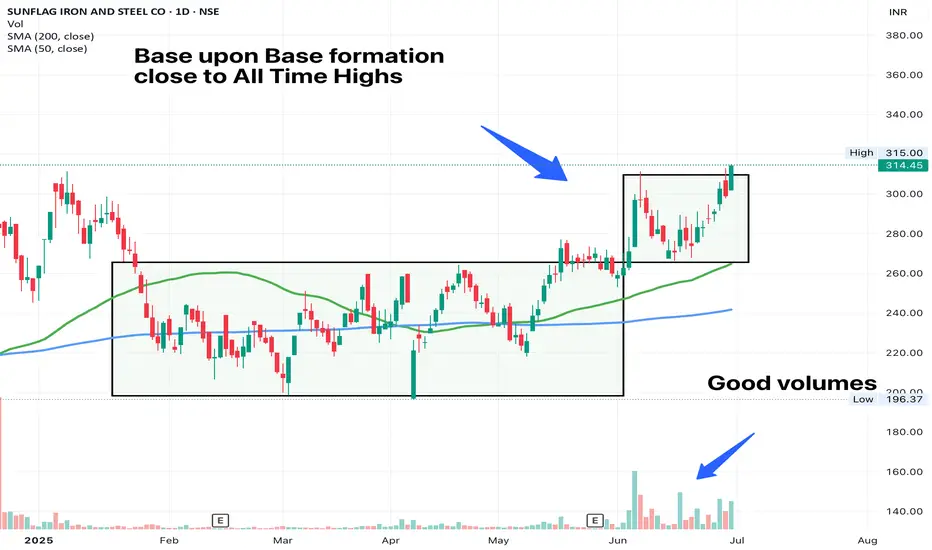
SUNFLAG - Base on Base FormationAnother set-up in the metals space. After Welcorp, LloydSME and APLApollo, this could be another favourable trade. The stock is attempting to breakout of the base today. Volumes have been good and the trend is already in place. Our job as a trader is to sit tight on structures till the trend lasts.
ABSLAMC - Cup and Handle BreakoutWithin the FinServ space, this is a lagging stock, but because the sector has tailwinds, I am inclined to go behind it. Birla is a household name and such stocks do well over a long period of time.

Trent on a bull mode?Broken 100ema and retested on 10ema and bounced with a big candle..
missed bottom pick..seems little more steam left.
6500 Target1..7k Target2
exit below 5900.
Slowly going up so need patience to hold..
part of tata group.
Trent Ltd is engaged in retailing of apparels, footwear, accessories, toys, games, food, grocery & non food products through various of its retail formats/ concepts.

MAHANAGAR GAS LTD ' S Key Level .This is the 4 hour chart of Mahanagar gas ltd.
MGL having a good law of polarity near at 1420 Range.
If this level is sustain , then we may see higher prices in MGL.
Thank You !!

TRANSRAILL - Typical Flag and Pole FormationGood momentum in the last 2 months. Breakout happened on Friday, lets see if we get a follow through in this week

DHANUKA - Flag and Pole BreakoutGood Momentum in the stock, volume during pullback has been low. Breaking out today after a nice consolidation

SBIN - VCP formationThe sector has a whole is lagging the broader market, private banks and financial services have been the leaders. Position size should be in check. Wait for trendline breakout for an ideal entry. This is a long term play.

TECHNOETechno Electric is looking good for swing target CMP: 1517 around.
Time: Few Days.
Target: 50,100 points can be earned!

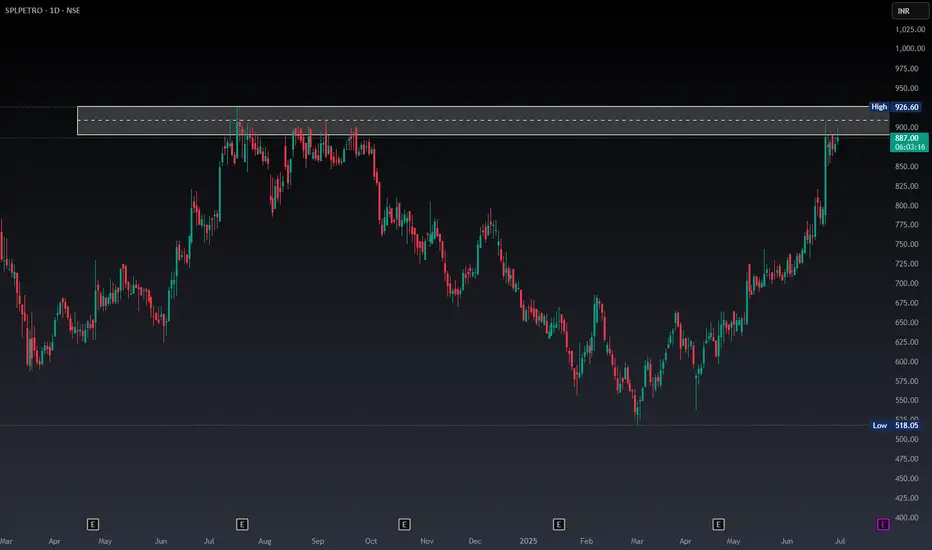
SPLPETRO - Looks stronger and can BreakoutSPLPETRO on the Breakout level and RSI on most TF looks positive, good chances of giving a breakout
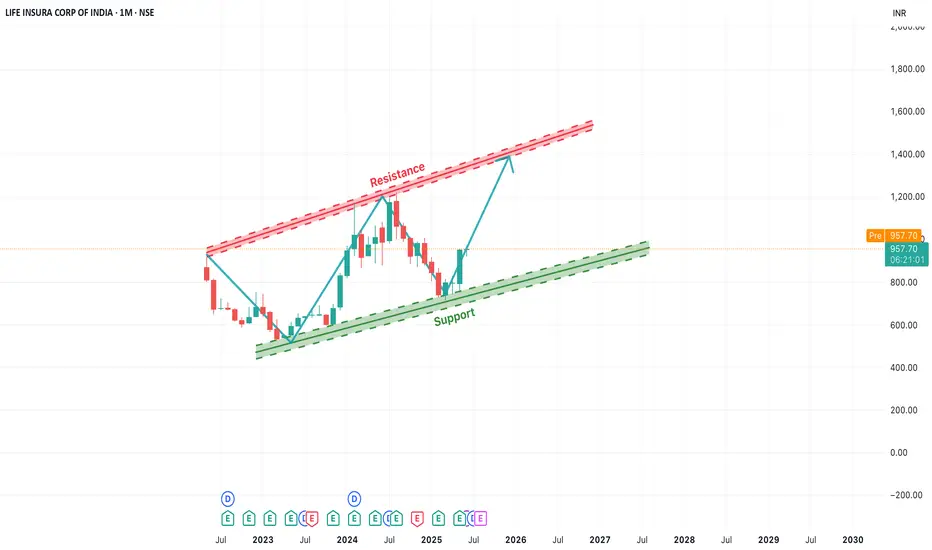
[Long-Term]LICI Rising Channel Pattern Indicates Bullish OutlookIn this monthly chart of LICI, we observe a clear ascending channel pattern forming over the past two years. The price has consistently respected both the support and resistance trendlines, creating a strong bullish structure.
Currently, the stock is bouncing off the lower support trendline, indicating a potential upward move towards the upper resistance zone. This offers a positive long-term outlook, especially if the momentum sustains. The key levels to watch are:
Support Zone: Around ₹850–₹900
Resistance Zone: ₹1250–₹1300
Traders and investors can monitor for a gradual rise toward the resistance level. A breakout beyond this channel may open up new highs, while a breakdown below the support trendline would invalidate the pattern.
APARINDS Trade for TomorrowApar Industries nicely moving in a tight range for more than a month, Looks like now ready to move up!

IIFL MOVING IN RANGEIIFL has recently BO and now moving in a tight range its previous resistance now become its support. Its likely to move up from here.

breakoutThe Accumulation
Refers to buying pressure, where more buyers than sellers are active in the market
