strong technical uptrendeverything mention about in my chart
I am not sebi reg
just my own technical analysis
happy trading
Happy good day....

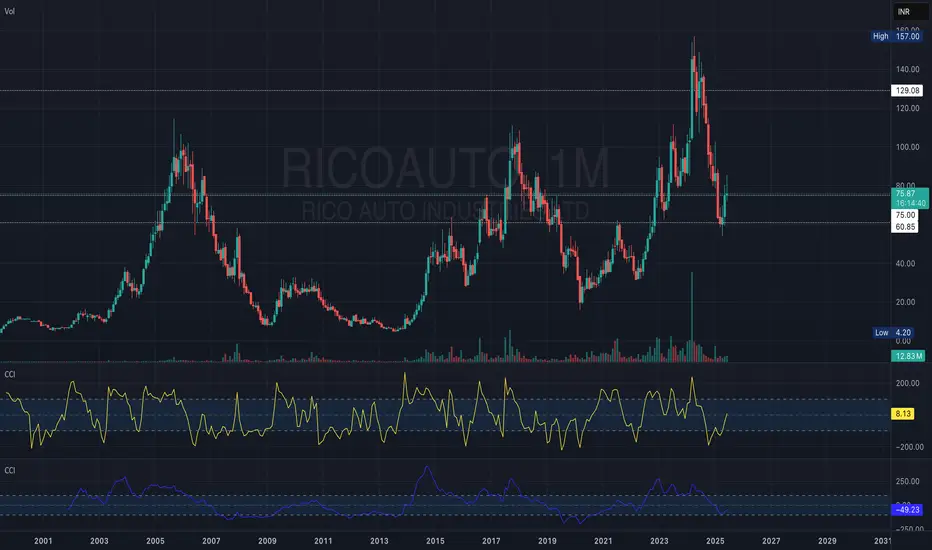
After recent correction Rico auto industries...After recent correction looks like Rico Auto found the base at 75 and will not go below 75, one can start buying in tranches for targets towards ATH...slow move....
INDUS TOWER - BREAKOUTNSE:INDUSTOWER Breakout stock with momentum indicators and multiple timeframe.


NCL IND - BREAKOUTNSE:NCLIND Breakout stock with multiple timeframe analysis and momentum indicators.


LTFOOD BUY @ 460-480. TARGET 800LTFOODS | Breakout 🍚🚀
Best Buy: ₹460–480
🎯 Target: ₹800+ in 6–12 months
#UniproMomentumPattern detected
📈 Strong volume surge + breakout from base
#LTFOODS #StockMarketIndia #BreakoutStocks #CupWithHandle #Multibagger


JUBILANT PHARMOVA - BREAKOUTNSE:JUBLPHARMA Breakout stock with momentum and bullish on multiple timeframes.

SML ISUZU - BREAKOUT RETEST BREAKOUTNSE:SMLISUZU Breakout stock with momentum indicators and bullish on multiple timeframes.

PRIVI SPECIALITY - BREAKOUT STOCKNSE:PRIVISCL Breakout stock on multi timeframe from qty , weekly, daily charts. momentum indicators also in force.

GRAPHITE - BREAKOUT NSE:GRAPHITE Breakout stock with consolidation of many years, weekly and monthly also positive.

DRREDDY Short_Broke down from 20 DEMADRREDDY SHORT:
- Bearish Engulfing Candle
- Support broken 20 DEMA
- Price may retest 20 DEMA before going down (if its going down)
- Enter when the price is favorable in the lower timeframe
- Target: 50 DEMA

Fortis Healthcare_Short_Rejection at All time HighFortis Healthcare Short:
- Price rejection All time High
- Bearish Engulfing Candle
- Short when Prices are favorable at the lower timeframe
- high probability trade
- Target: 20 DEMA
- SL: 803 (Friday's High)

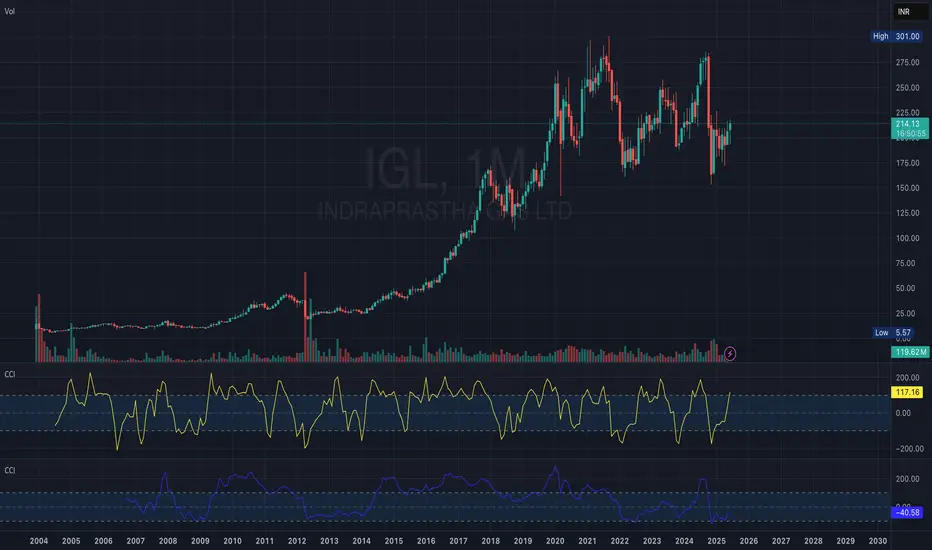
IGL can move back to ATHIGL trying to break the resistance price around 214, once breaks it, slowly IGL can move back to ATH.
nbcc stockIn NBCC stock, a cup and handle pattern has formed on the 15-minute time frame and it is now retesting. One should watch this stock — a big move could come.

Asian Paints Long_Support @ 20 DEMA, Turnaround StoryAsian Paints Long:
-Price takes support at 50 DEMA & 20 DEMA
-Bullish Engulfing Candle with Good Volume
- Target 200 DEMA
- SL: Close below 20 DEMA
- Enter when prices are favorable in the lower timeframe

Heromoto Long_Price support @ 20 DEMAHeromoto Long:
-Price takes support @ 20 DEMA & 200 DEMA
-20 DEMA Crosses above 200 DEMA
-Price consolidating for last 1 month after reversal.
-Enter long when the price is favorable in the lower timeframe

wareerti stock Cup and handle Wareerti formed a cup and handle pattern and also broke out; now it’s retesting. At this price, an entry can be made with a small stop loss — check it out and do your own analysis at your own risk. My analysis is mostly wrong anyway."
Entry kab avoid karein:
Agar retest zone par repeatedly price sustain nahi kar raha.
Retest par bhi selling pressure high ho raha hai (volume high).
Market sentiment overall bearish ho.
cup and handle breakout retest entry
Retest price: Retest ideally breakout level ke aas-paas ya thoda upar hota hai. Agar retest bahut deep chala gaya (cup ki midpoint ya handle ke bottom tak), toh setup weak ho jata hai.
Volume confirmation: Breakout par volume high hona chahiye, aur retest par volume kam hona chahiye.
Price action: Retest par bullish candle, hammer, bullish engulfing ya koi bhi strong reversal candle milti hai toh aur confirmation milta hai.
Stop-loss: Retest low ke thoda niche ya handle ke low ke niche (as per risk appetite).

NAVINFLUOR on the Verge of BreakoutNAVINFLUOR is on the Breakout level, but there is a negative RSI divergence in both DTF and WTF. Hence expecting it to Breakdown, unless heavy buying comes in and shoot RSI in overbought zone.
Stock is NC, but shared for learning purpose

[LTF] Long TermHi there,
LTF is looking good for long term only if monthly candle closes above the ATH. Breakout of Cup and Handle is a strong uptrend.
This is only for educational purpose, pls consult your financial advisor before investing.

LT FOODS LTD on WeeklyLT FOODS LTD on this week give buy signal on our private indicator "VaultSignal Pro Weekly".
Watch W.ADR% and trade according to it.

Ceat this just for study purpose ,not buy and sell recomondationAs per my analysis Ceatltd can reach 38.2%-50% range. to complete 4th wave , this is just for study purpose and not a buy or sell recommendation.
