Narayana Hrudayalaya - Strong Fundamental & TechnicalFundamental plus Technical Analysis on a Financially Strong Company:
Narayana Hrudalaya Ltd is engaged in providing economical healthcare services. It has a network of multispecialty and super specialty hospitals spread across multiple locations.
Focus
Company plans to add 700 plus beds for the next 3-4 years at Bangalore Health City. It intends to invest upto Rs. 1,000 Cr in the West Bengal for setting up a superspecialty hospital.
Capex Plan
Company has planned a total capex of 1136 Cr for FY24 and till Q3 FY24 it has spent 477 Cr.
Stock P/E - 31.7
Industry PE - 56.3
EPS growth 5Years - 67.8 %
Buy Score - 4.56 (Buy Score above 0 for me, is considered very good and above 1, excellent.)
ROCE 5Yr - 19.6 %
Please note that this idea is meant to spread awareness and should NOT be considered a buy recommendation. Do your own research before making any financial commitments.

Jio Financials Inverse Head & ShoulderThere is a developing pattern on the charts of Jio Financials.
The levels are marked clearly.
This is to spread awareness and pass my technical analysis learnings.
Conduct your own research before taking any financial decision.

Shemaroo Breakout Watch | Near 200-DMA ResistanceShemaroo Entertainment (NSE: SHEMAROO) is showing strong bullish momentum and has recovered sharply from ₹88 levels to ₹126.84. The stock is now testing the 200-Day Moving Average resistance.
📊 Technical Analysis:
• Trading near long-term 200-DMA (trend decider)
• RSI is strong but not overbought yet
• Volume increasing — suggests accumulation
🔹 Key Levels:
• Resistance: ₹128–₹132
• Breakout Above: ₹132
• Support Zone: ₹118–₹120
🎯 Targets post-breakout:
• Target 1: ₹145
• Target 2: ₹160
🚫 Stoploss: ₹117
⸻
⚠️ Disclaimer:
This is not investment advice. I am not a SEBI-registered advisor. This analysis is shared only for educational and informational purposes. Please consult your financial advisor before making any investment.

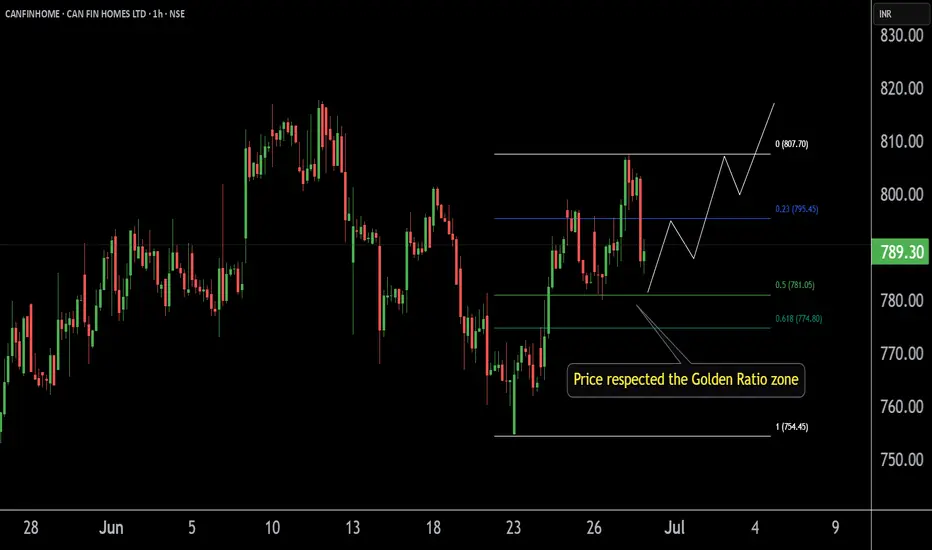
CANFINHOME'S Key ZoneThis is the 1 hour chart of CANFINHOME.
Canfinhome is taking support at the Fibonacci Golden Ratio zone.
If this zone is sustain then we may higher price in CANFINHOME .
Thank You !!
NSE:TATACONSUM CHART PATTERN ANALYSIS🔍 Chart Pattern Analysis:
Pattern Identified: Bullish Flag
Pole: The sharp move up from March to early May.
Flag: The downward-sloping parallel channel (purple lines) forming from mid-May to late June.
Breakout Zone: Price has approached the upper boundary of the flag, suggesting a potential breakout.
📊 Volume Analysis:
Volume increased during the flagpole (strong buying).
Volume decreased during consolidation in the flag (healthy sign for a flag pattern).
A volume spike during breakout (not yet seen) would confirm bullish momentum.
📈 Price Projection:
Based on the flagpole height:
Pole height: Approx. ₹1060 to ₹1245 = ₹185
Breakout level: Around ₹1150
Target: ₹1150 + ₹185 = ₹1335
Your chart already shows a projected upward move towards the ₹1,350–₹1,400 region, aligning with this measured move.
✅ Bullish Confirmation Signals:
Price nearing breakout above the flag.
Strong trend from earlier (bullish continuation expected).
Breakout may lead to quick momentum-driven gains.
⚠️ Risks & Invalidations:
Breakdown below flag support (~₹1,080) invalidates the pattern.
Bearish candle near breakout zone without volume can indicate a fakeout.
Broader market weakness may weigh on follow-through.
📝 Conclusion:
This is a bullish continuation pattern (flag).
A breakout above ₹1,160 with volume confirms an upward target of ₹1,330–1,400.
Ideal entry: On breakout with volume.
Stop-loss: Below ₹1,080 (flag low).
Let me know if you’d like a Pine Script for this pattern or volume-based alerts for breakout confirmation.

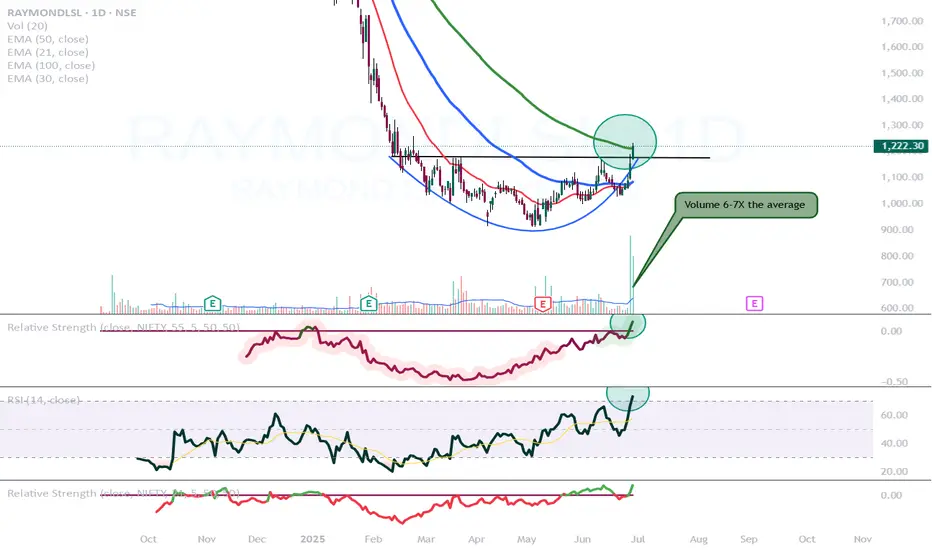
Raymond Lifestyle is looking good!NSE:RAYMONDLSL
- After a 5 month long consolidation now breaking out.
- This is looking like a stage 2 breakout.
- Relative strength turned positive.
- RSI is above 70 indicating very high momentum
- Volume is also very good on the break out candle. Also we can observe that volume is higher on the green candles and lower on the red ones.
- Today it closed above its 100 day exponential moving average as well.
COCHINSHIP SWING ANALYSIS ( 25% Upside )COCHINSHIP SWING ANALYSIS ( 25% Upside )
Thanks for stopping by
Regards
PsychoTrader

HDFC Life Insurance Buy27-Jun-2025 (Friday)
HDFC Life Insurance reversed taking support from channel line as well as it previous ATH. Seems to make false breakdown and reversed upside to new ATH. Buy @CMP (807) with SL of 770 and target of 840-860

HDFC Asset Management Buy27-Jun-2025 (Friday)
HDFC Asset Management bounced back from trend line. Also it tested previous ATH as support and reversed upwards. Buy @CMP (5150) with SL of 4860 and target of 5250, 5550-5600 & 6900

HDFC Bank BuyHDFC Bank bounced back from its trend line. also break above a consolidating range. Buy @CMP (2015) with SL of 1960 and a target of 2500.

JYOTICNC Swing Analysis ( Holding 3-6 Months, 20% Upside )JYOTICNC Swing Analysis ( Holding 3-6 Months, 20% Upside )
Thanks for Stopping By.
Regards
PsychoTrader

#ASHOKLEY - Pivot Point is 239.47Date: 27-05-2025
Pivot Point: 239.47 Support: 233.96 Resistance: 245.02
Upside Targets:
Target 1: 250.90
Target 2: 256.79
Target 3: 263.29
Downside Targets:
Target 1: 228.057
Target 2: 222.15
Target 3: 215.65
#AshokLeyChartPatterns

GMR: Asset Rich; P&L Poor- SELLHighest Losses
Reduction in Borrowings has not brought down the interest burden as rates have shot up.

a Clear indication of breakout for Sun Pharma keep it on trackI have jotted down the Gann Box of 90 days. I have place Gann Box together to understand the trend line of Sun Pharma

VOLTAMP | Detailed Analysis | with Target & Stop-lossDisclaimer:
This is not financial advice. Please do your own research or consult with a financial advisor before making any investment decisions. Investments in stocks can be risky and may result in loss of capital.

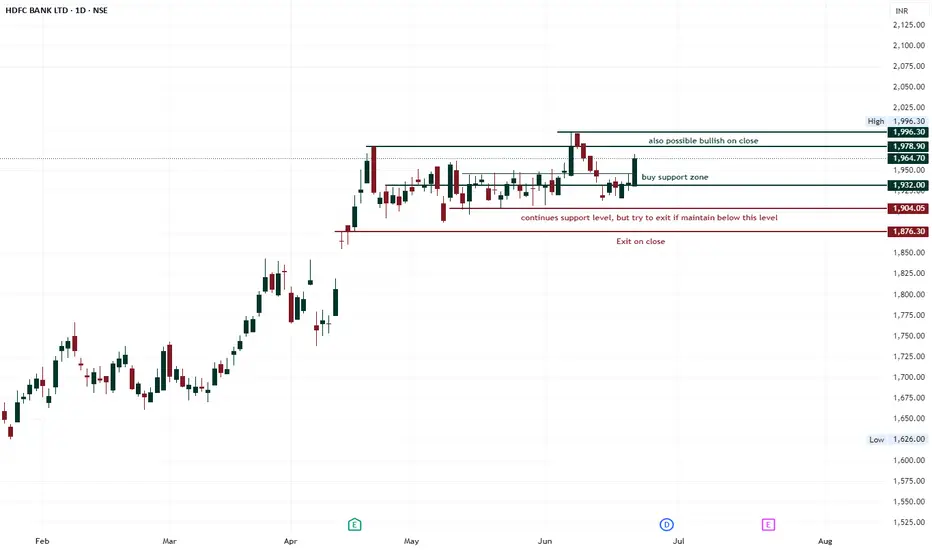
hdfc bank reportbullish pattern with candle pattern. every time support 1905 level, but no break to 1876
Positional Setup: IDBI Bank Ltd (NSE)Chart Pattern: Cup and Handle Formation
CMP: ₹101.33
Technical Structure: Classic bullish Cup & Handle breakout setup in progress
Volume: Noticeable rise in volumes at breakout zones
Momentum: RSI & moving averages support the trend continuation
📊 Technical Levels (Positional Setup)
Support Zones: ₹95 / ₹90
Breakout Zone: ₹101–104 (once cleared, confirms the breakout)
Targets Post Breakout:
🎯 T1: ₹115
🎯 T2: ₹125
🎯 T3: ₹135
Stop Loss: Below ₹90 (closing basis)

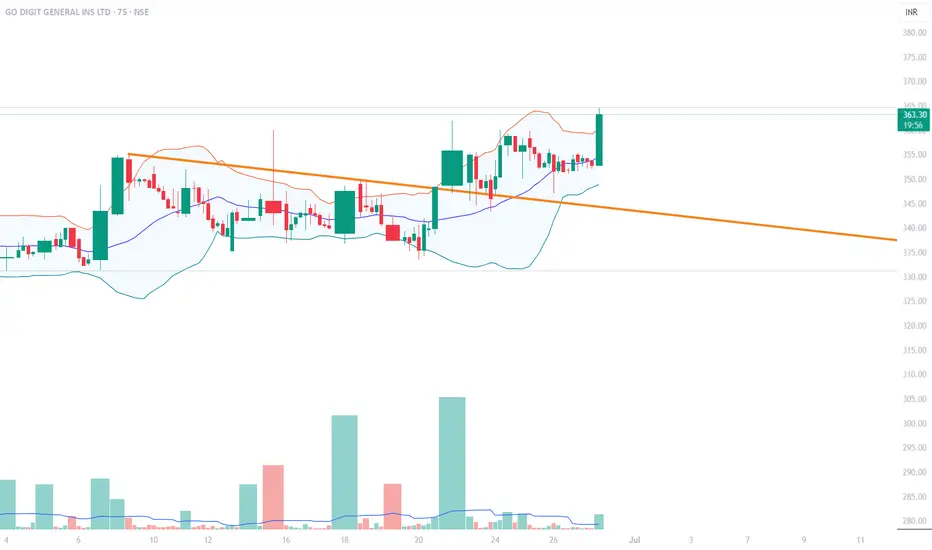
GODIGIT!GODIGIT READY FOR BLAST! SHARP CONSOLIDATION AND BREAKOUT READY TO MAKE A UPWARD MOVE! STOPLOSS 345 AND TARGET 400!
Pls note all the messages posted are for study and guidance purpose
Please consult your financial advisor before investing ⚠

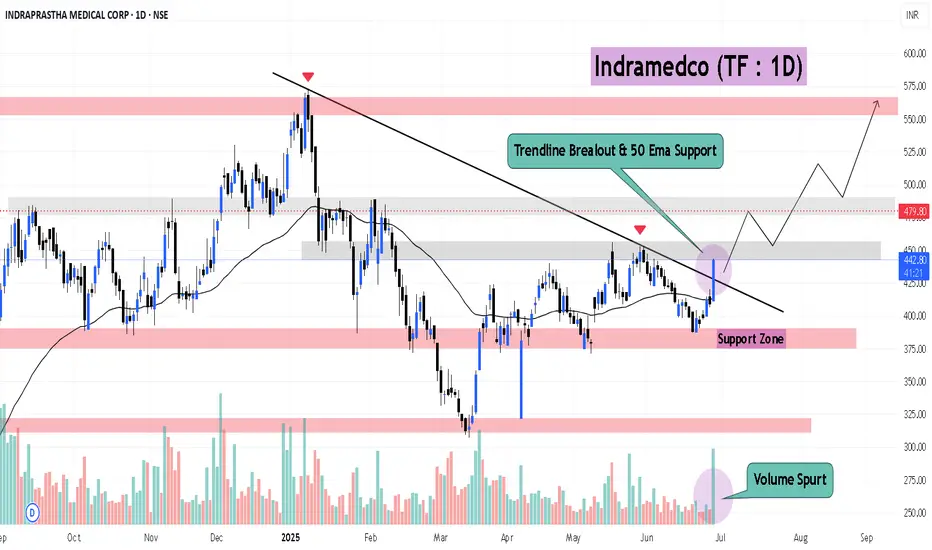
Strong #BreakoutStock : INDRAMEDCOStrong #BreakoutStock : INDRAMEDCO📈
- Trendline Breakout following 50 ema support
- Volume Spurt
- Steady rising Volume
📌Potential upside 📈
BAJAJ AUTO LTD – Trendline Breakout with Upside Potential NSE:BAJAJ_AUTO – Trendline Breakout (The setup offers a favorable risk-reward ratio, with potential for ~500+ points upside from the breakout zone.)
Chart Type: Daily (1D)
Current Price: ₹8,455
Structure: Falling wedge breakout with defined targets
Falling Wedge Formation:
The price has been consolidating within a falling wedge pattern, indicating a potential bullish reversal.
Both upper and lower trendlines (labeled as "small down trend") have been respected multiple times, validating the structure.
Breakout Confirmation:
A breakout above the descending trendline has occurred, accompanied by a bullish candle closing above the immediate resistance zone around ₹8,407.
This marks the breakout point and indicates a shift in momentum.
Support Zone:
Strong support has been established near ₹8,225.55, as marked on the chart.
This level can serve as a stop-loss for bullish positions.
-----
BUY: above 8410-8450
SUPPORT ( SL ) : 8220
RESISTANCE ( TGT) :8640-8780-9000+++

MOIL - Potential for 500 target with Crown pattern in makingMOIL has confirmation for Bullish crown formation .
It has closed above 20 & 50 EMA on day time frame.
Moreover MACD is signal line has turned positive.
With all this it has potential for following targets;
360 / 400 / 450 / 500
SL: 315
