50% Positional Target StockRamkrishna Forgings Ltd is primarily engaged in manufacturing and sale of forged components of automobiles, railway wagons & coaches and engineering parts. It is the 2nd largest forging player in India.

Review and plan for 27th June 2025Nifty future and banknifty future analysis and intraday plan.
Swing trade.
This video is for information/education purpose only. you are 100% responsible for any actions you take by reading/viewing this post.
please consult your financial advisor before taking any action.
----Vinaykumar hiremath, CMT

TUBE INVEST OF INDIA at Best Support This is the 4 hour Chart of TIINDIA.
TIINDIA is holding within the Fibonacci retracement golden zone.
If this level is sustain , then we may see higher prices in TIINDIA.
Thank You !!

ALLCARGO LOGISTICS at Best Support !!This is the 4 hour Chart of ALLCARGO LOGISTICS.
ALLCARGO is having good law of polarity at 33 range .
Price action confirms a retest of the support zone at 33 range.
Price action indicates a bullish HH-HL formation.
If the support level sustains, the stock has the potential to make a new high.
Thank You !!

ETERNAL gaining momentum!NSE:ETERNAL seems to be gaining momentum
RS positive
RSI Above 60
Trying to break out.
We need volume confirmation on this breakout.
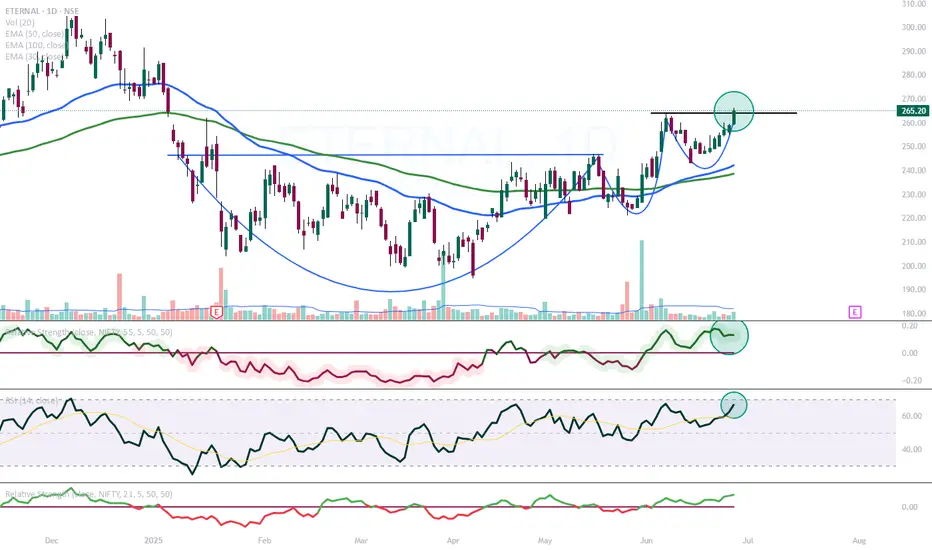
ETERNAL| Buy @LTP | SL below 240 | Targets 326, 440Disclaimer:
This is not financial advice. Please do your own research or consult with a financial advisor before making any investment decisions. Investments in stocks can be risky and may result in loss of capital.

SHRIRAMFIN | Risk-Takers Buy @LTP, Safer Entry Above 723, SL 640Disclaimer:
This is not financial advice. Please do your own research or consult with a financial advisor before making any investment decisions. Investments in stocks can be risky and may result in loss of capital.

TBOTEK | Risk-Takers Buy @LTP, Safer Entry Above 1410, SL 1230Disclaimer:
This is not financial advice. Please do your own research or consult with a financial advisor before making any investment decisions. Investments in stocks can be risky and may result in loss of capital.

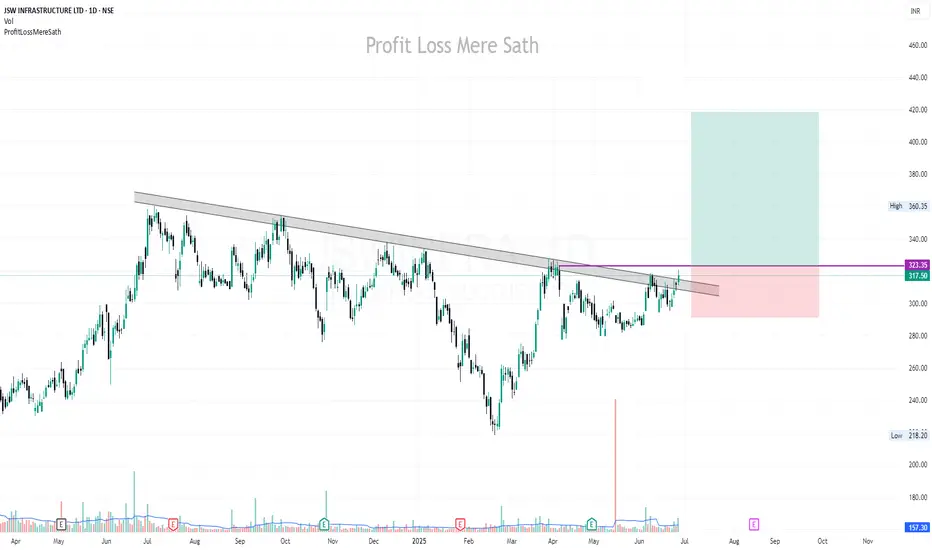
JSWINFRA | Buy Above 324 | SL Below 290 | Target 417Disclaimer:
This is not financial advice. Please do your own research or consult with a financial advisor before making any investment decisions. Investments in stocks can be risky and may result in loss of capital.
TITAGARH-EQ has given breakout and will likely retest its high continuing with our railways theme.
TITAGARH-EQ has given a breakout of its resistance channel and will retest its high.
price is has taken support at its strong support zone.
immediate target is around 1250 - 1350 lvls and if fundamentals support it is poised to break its previous high lvls.
as always people are advised to trade as per their risk capacity.

TECHNO ELEC & ENG CO. LTD - CUP and Handle Pattern 1DTECHNO ELEC & ENG CO. LTD, Buy Signals by our Private Indicator, and can be trade according to upper resistance line(Yellow) and ADR% (Upper Right Corner).

NUVAMA : Opened a position with 1% riskEntered the position immediately at the close of the strong bullish momentum candle that broke the ATH levels.
📢📢📢
If my perspective changes or if I gather additional fundamental data that influences my views, I will provide updates accordingly.
Thank you for following along with this journey, and I remain committed to sharing insights and updates as my trading strategy evolves. As always, please feel free to reach out with any questions or comments.
Other posts related to this particular position and scrip, if any, will be attached underneath. Do check those out too.
Disclaimer : The analysis shared here is for informational purposes only and should not be considered as financial advice. Trading in all markets carries inherent risks, and past performance is not indicative of future results. It’s essential to conduct your own research and assess your risk tolerance before making any investment decisions. The views expressed in this analysis are solely mine. It’s important to note that I am not a SEBI registered analyst, so the analysis provided does not constitute formal investment advice under SEBI regulations.

NH : An upcoming entry Will be looking forward for an entry in this scrip if price retests the ATH. The entry will be taken with 1% risk. The target levels might vary depending on the momentum in the coming days.
Entry is invalid if the current high is taken out.
📢📢📢
If my perspective changes or if I gather additional fundamental data that influences my views, I will provide updates accordingly.
Thank you for following along with this journey, and I remain committed to sharing insights and updates as my trading strategy evolves. As always, please feel free to reach out with any questions or comments.
Other posts related to this particular position and scrip, if any, will be attached underneath. Do check those out too.
Disclaimer : The analysis shared here is for informational purposes only and should not be considered as financial advice. Trading in all markets carries inherent risks, and past performance is not indicative of future results. It’s essential to conduct your own research and assess your risk tolerance before making any investment decisions. The views expressed in this analysis are solely mine. It’s important to note that I am not a SEBI registered analyst, so the analysis provided does not constitute formal investment advice under SEBI regulations.

SONACOMSSONACOMS
watch above levels. green line is our entry, redline is our SL.
DISCLAIMER : I am NOT a SEBI registered advisor or a financial adviser. All the views are for educational purpose only.

Positional Setup: Rainbow Children’s Medicare Ltd (NSE)
📍 Chart Analysis Summary
CMP: ₹1513.20
Structure: Strong breakout from a rounded base; retesting previous resistance zones
Volume: Gradual accumulation with spikes on breakout sessions
Momentum: RSI supportive of upside continuation
📊 Technical Levels (Positional Setup)
Support Zones: ₹1435 / ₹1370
Resistance Zones: ₹1575 → then ₹1710
Breakout Confirmation: Price has closed above consolidation zone with momentum
Setup Type: Base breakout + higher lows forming for several weeks
🎯 Positional Targets:
Target 1: ₹1575
Target 2: ₹1710
Target 3 (Extended): ₹1850+
Stop-Loss (Closing Basis): ₹1435

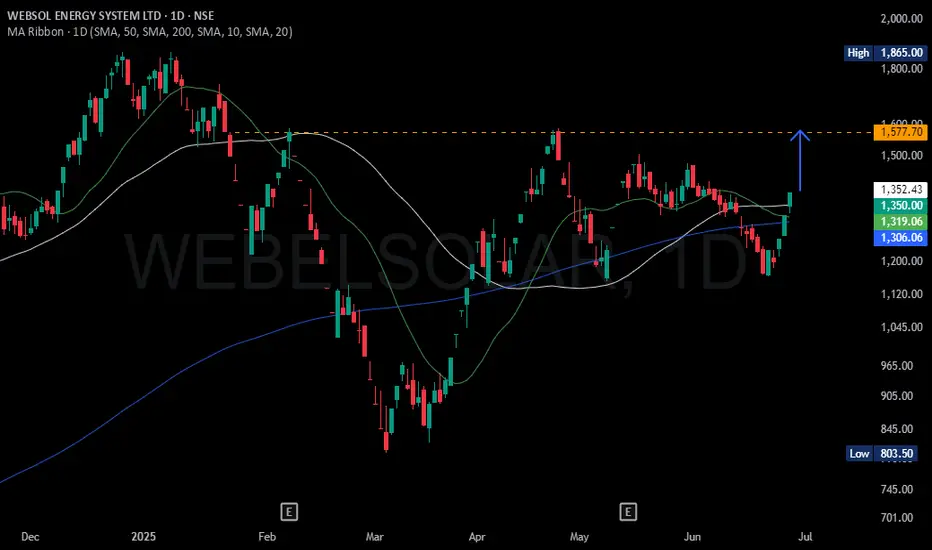
WEBELSOLAR : Heading towards BrakOutWebel Solar, nearing to previous high potential 13% up side from current level and there after break out
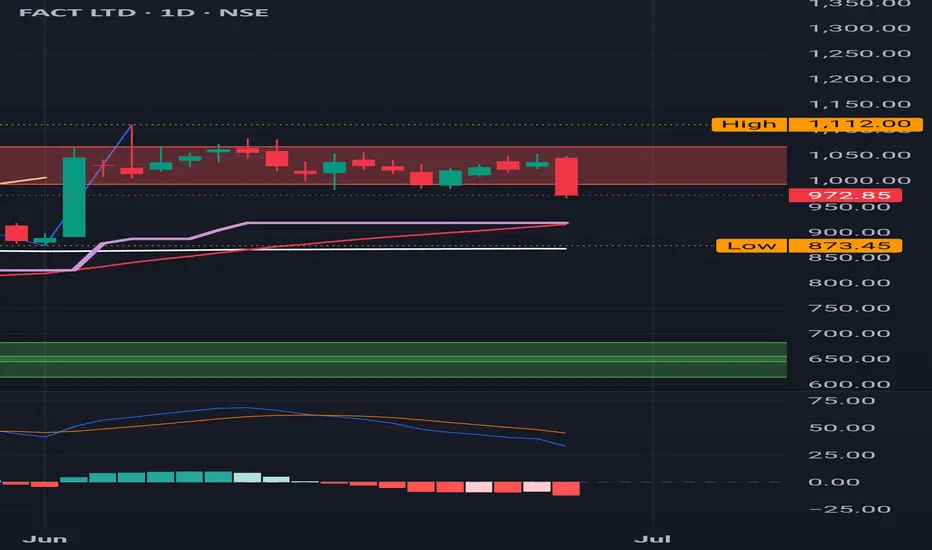
FACT : Sitting at the Major Red Band Resistance
FACT : Sitting at the Major Red Band Resistance
MACD is also Negative
( Not a Buy / Sell Recommendation
Do your own due diligence ,Market is subject to risks, This is my own view and for learning only .)
DEEPAKNTRDEEPAKNTR
watch above levels. green line is our entry, redline is our SL.
DISCLAIMER : I am NOT a SEBI registered advisor or a financial adviser. All the views are for educational purpose only.

REL Power : It has to clear the Red band Resistance REL Power : It has to clear the Red band Resistance to move forward.
This is 3M Time Frame.
( Not a Buy / Sell Recommendation
Do your own due diligence ,Market is subject to risks, This is my own view and for learning only .)

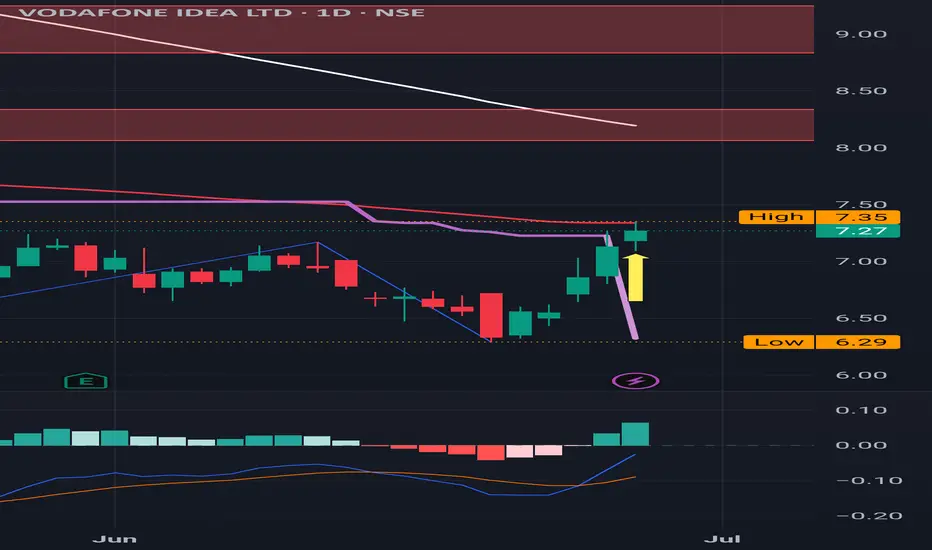
Vodafone Idea: Moving to a Buy trajectory
Vodafone Idea: Moving to a Buy trajectory
Recovered quite well from the support with back to back Greens as displayed on the Chart
Tough road ahead with multiple Red Band Resistances.
MACD is positive almost approaching an important level of 0.
( Not a Buy / Sell Recommendation
Do your own due diligence ,Market is subject to risks, This is my own view and for learning only .)
REL: Sitting at the major Red Band Resistance REL : Sitting at the major Red Band Resistance
It has to clear this to reach out to the important peak level of 1608 which happened last year almost the same time in July 2024 .
( Not a Buy / Sell Recommendation
Do your own due diligence ,Market is subject to risks, This is my own view and for learning only .)

shrirampiston buy @ 2400 , target 5000SHRIPISTON
> Cup and Handle breakout in progress.
> 📍Buy: ₹2400 | 🎯 Target: ₹5000 in 2–3 years
> Auto ancillaries quietly leading — multibagger setup alert!
> \#Multibagger #TechnicalAnalysis #AutoAncillary #SHRIPISTON
