TATA MOTOR - LONGNSE:TATAMOTORS Weekly rounding bottom at location with accumulation formation of inv head and shoulder.

ADANI Power: From Buy to Sell and from Sell to BuyADANI Power: From Buy to Sell and from Sell to Buy. What a strange movement .
610 is a first resistance level to test.
( Not a Buy / Sell Recommendation
Do your own due diligence ,Market is subject to risks, This is my own view and for learning only .)

Reversal !Reversal after a long down run, nifty IT also bullish. Lets see how it will perform. It should do well! based on my study. Guys what do you think?

Transrail Lighting daily chartTransrail Lighting looks gaining momentum I am looking for quick 10%. If breaks above the channel and sustains, then it can hit Rs1000+.
Not a buy-sell recommendation, do your own diligence or consult your financial advisor.

#MPHASIS - 2309 OR 2746.60?Date: 27-05-2025
#MPHASIS Current Price: 2537.8
Mid-Point: 2527.80
,
#MPHASIS Upside Levels: 2671.01, 2746.60, 2828.65 and 2910.70
#MPHASIS Downside Levels: 2384.87, 2309.00, 2226.95 and 2144.90
Support: 2460.73
Resistance: 2595.41
#MPHASISChartAnalysis
#MPHASISChartPatterns

should go to 2300 after retesting the breakoutNow the stock is retesting the breakout area out of cup and handle, if this turns out to be true, the next target should be 2300.

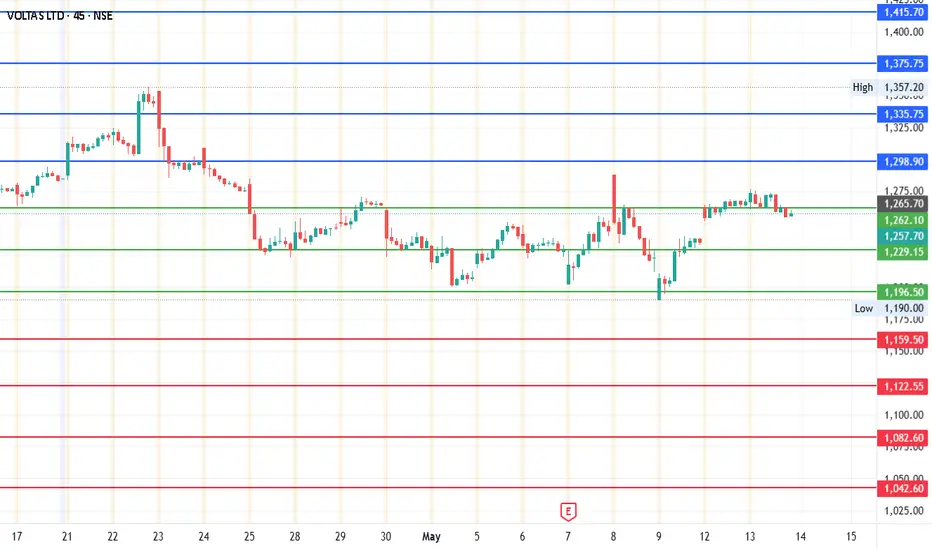
Voltas - Short TermCurrent Price: 1257.7
Mid-point: 1229.15
Upside Targets: 1298.91, 1335.75, 1375.73 and 1415.70
Downside Targets: 1159.52, 1122.55, 1082.58 and 1042.60
Support: 1196.49
Resistance: 1262.08
#Voltas
#VoltasChartPatterns
Possible Long ???It has broke the triangle pattern and trying to move higher, possibility to reach new higher highs.

RELIANCE INDUSTRIES at Key Zone !!This is the 1 hour Chart of RELIANCE INDUSTRIES.
Stock has formed a large Broadening Wedge pattern, with a projected target around the 1560 range.
Stock has formed a ascending triangle patterrn with a projected target around the 1560 range.
stock has given a breakout at 1460 range. If it successfully retests and holds this level as support , then we may see higher prices in RELIANCE INDUSTRIES.
Thank you !!

JIOFIN - The real test.As always, the chart is self-explanatory.
- The price is at a dual resistance point: previous support turned resistance and trendline resistance.
- Crossing this point will be crucial if the price needs to maintain its upward momentum.
Do you think Jio can do it in the first go?
Disclaimer: The information provided in this post is for educational and informational purposes only and should not be considered as financial advice. I am not a licensed financial advisor, and this content is based on my personal analysis and opinions. Trading stocks involves significant risk, and you should conduct your own research or consult with a qualified financial advisor before making any investment decisions. Past performance is not indicative of future results. I am not responsible for any financial losses or gains you may incur as a result of using the information provided herein.

#FORTIS Today this stock brooked ATH level with strong volume. Through It can be predicted here that this will be a good investment option for the short term and long term.
CMP - 790
Key level:-
1) triangle pattern breakout
2) high volume
3) stock sustaining previous high
4) retest like formation

INDIANB - 640 ABOVEIndianb no have in very good levels, long consolidation breakout and sustaining near
ATH...
Above 640 possible good rally up side for short term gain

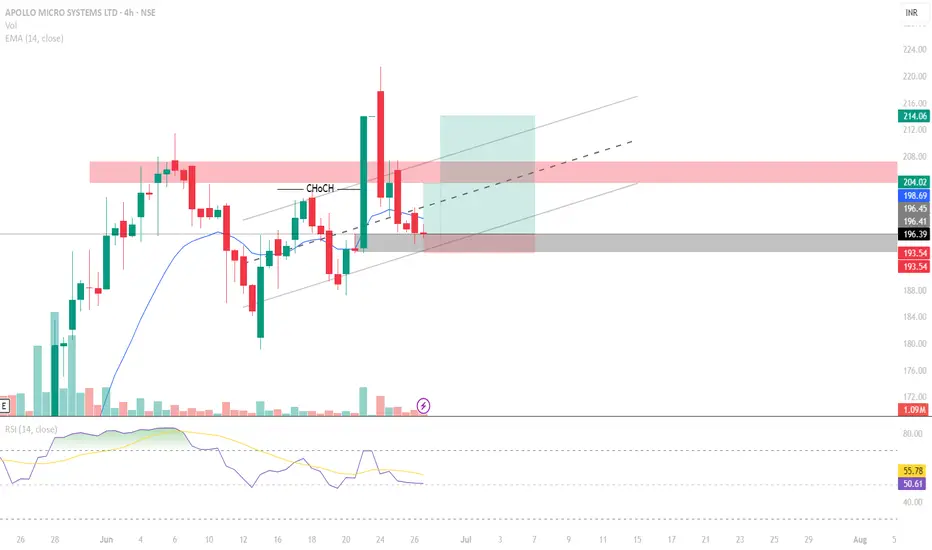
APOLLO MICRO SYSTEMSA 4 Hour CHoCH seen with a huge green closing candle
Tapped into the 50 % OB region
50% Positional Target StockRamkrishna Forgings Ltd is primarily engaged in manufacturing and sale of forged components of automobiles, railway wagons & coaches and engineering parts. It is the 2nd largest forging player in India.

Review and plan for 27th June 2025Nifty future and banknifty future analysis and intraday plan.
Swing trade.
This video is for information/education purpose only. you are 100% responsible for any actions you take by reading/viewing this post.
please consult your financial advisor before taking any action.
----Vinaykumar hiremath, CMT

TUBE INVEST OF INDIA at Best Support This is the 4 hour Chart of TIINDIA.
TIINDIA is holding within the Fibonacci retracement golden zone.
If this level is sustain , then we may see higher prices in TIINDIA.
Thank You !!

ALLCARGO LOGISTICS at Best Support !!This is the 4 hour Chart of ALLCARGO LOGISTICS.
ALLCARGO is having good law of polarity at 33 range .
Price action confirms a retest of the support zone at 33 range.
Price action indicates a bullish HH-HL formation.
If the support level sustains, the stock has the potential to make a new high.
Thank You !!

ETERNAL gaining momentum!NSE:ETERNAL seems to be gaining momentum
RS positive
RSI Above 60
Trying to break out.
We need volume confirmation on this breakout.
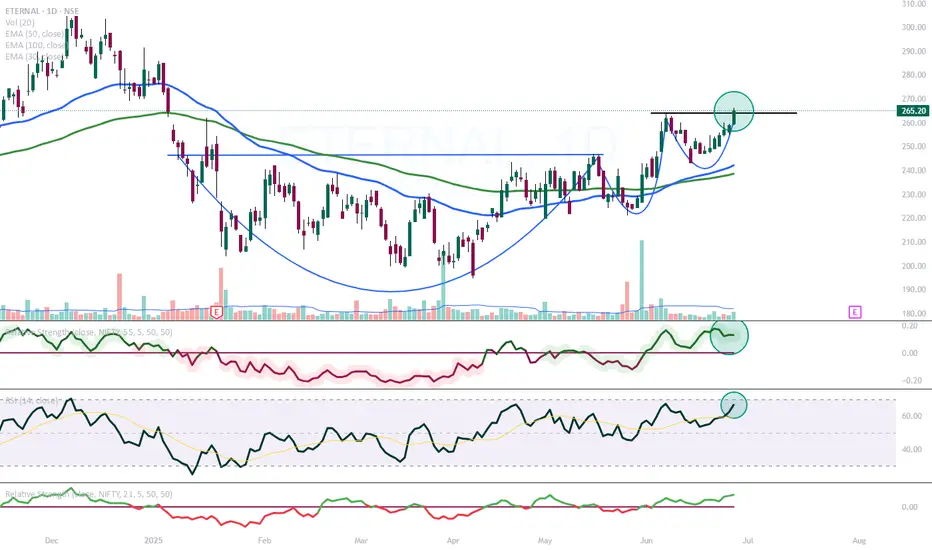
ETERNAL| Buy @LTP | SL below 240 | Targets 326, 440Disclaimer:
This is not financial advice. Please do your own research or consult with a financial advisor before making any investment decisions. Investments in stocks can be risky and may result in loss of capital.

SHRIRAMFIN | Risk-Takers Buy @LTP, Safer Entry Above 723, SL 640Disclaimer:
This is not financial advice. Please do your own research or consult with a financial advisor before making any investment decisions. Investments in stocks can be risky and may result in loss of capital.

TBOTEK | Risk-Takers Buy @LTP, Safer Entry Above 1410, SL 1230Disclaimer:
This is not financial advice. Please do your own research or consult with a financial advisor before making any investment decisions. Investments in stocks can be risky and may result in loss of capital.

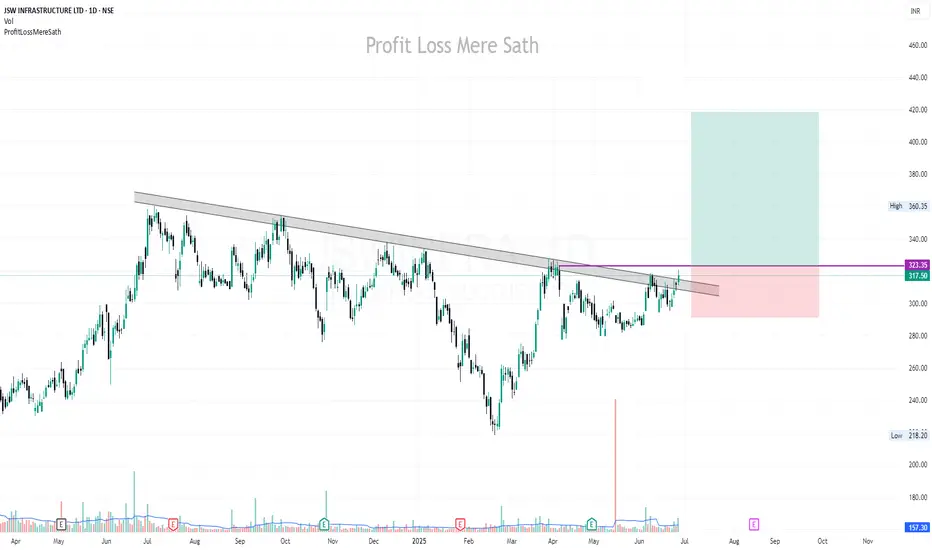
JSWINFRA | Buy Above 324 | SL Below 290 | Target 417Disclaimer:
This is not financial advice. Please do your own research or consult with a financial advisor before making any investment decisions. Investments in stocks can be risky and may result in loss of capital.
TITAGARH-EQ has given breakout and will likely retest its high continuing with our railways theme.
TITAGARH-EQ has given a breakout of its resistance channel and will retest its high.
price is has taken support at its strong support zone.
immediate target is around 1250 - 1350 lvls and if fundamentals support it is poised to break its previous high lvls.
as always people are advised to trade as per their risk capacity.
