
Positional Setup: Rainbow Children’s Medicare Ltd (NSE)
📍 Chart Analysis Summary
CMP: ₹1513.20
Structure: Strong breakout from a rounded base; retesting previous resistance zones
Volume: Gradual accumulation with spikes on breakout sessions
Momentum: RSI supportive of upside continuation
📊 Technical Levels (Positional Setup)
Support Zones: ₹1435 / ₹1370
Resistance Zones: ₹1575 → then ₹1710
Breakout Confirmation: Price has closed above consolidation zone with momentum
Setup Type: Base breakout + higher lows forming for several weeks
🎯 Positional Targets:
Target 1: ₹1575
Target 2: ₹1710
Target 3 (Extended): ₹1850+
Stop-Loss (Closing Basis): ₹1435

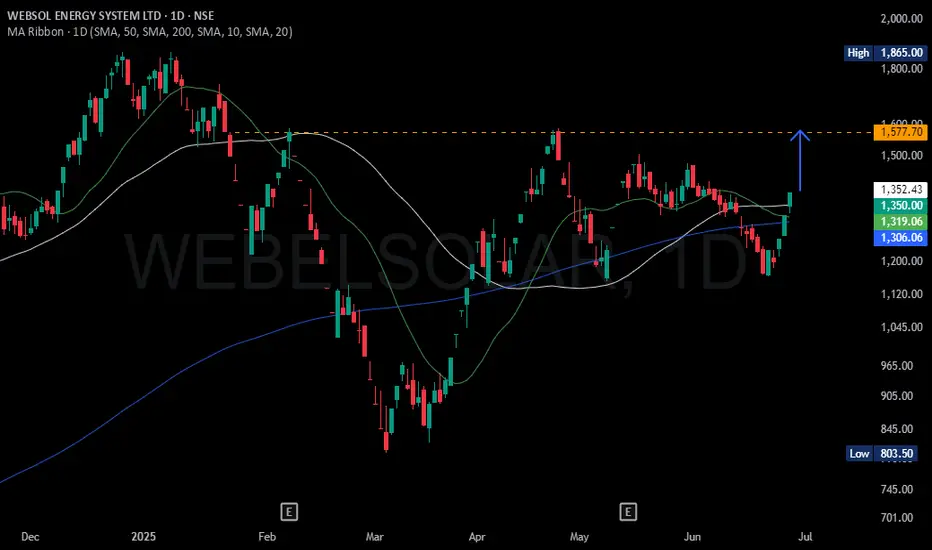
WEBELSOLAR : Heading towards BrakOutWebel Solar, nearing to previous high potential 13% up side from current level and there after break out
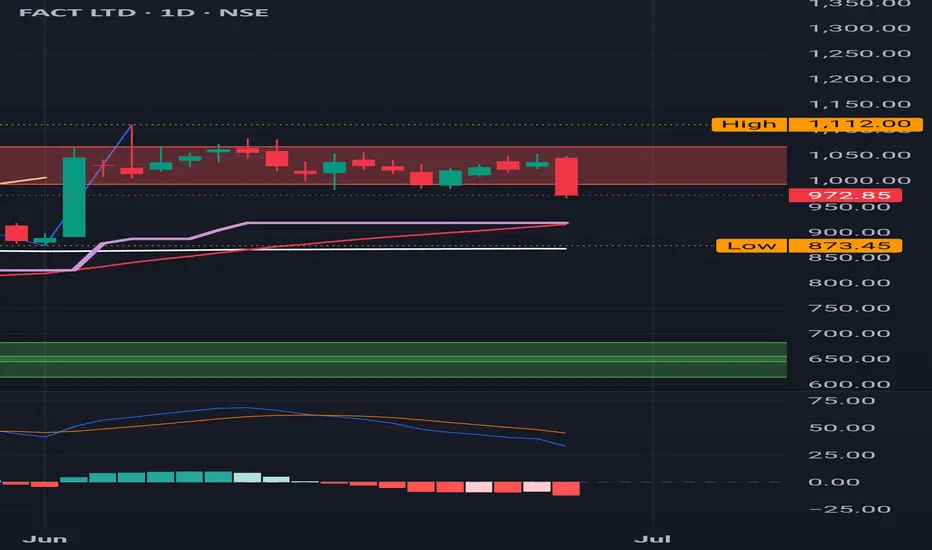
FACT : Sitting at the Major Red Band Resistance
FACT : Sitting at the Major Red Band Resistance
MACD is also Negative
( Not a Buy / Sell Recommendation
Do your own due diligence ,Market is subject to risks, This is my own view and for learning only .)
DEEPAKNTRDEEPAKNTR
watch above levels. green line is our entry, redline is our SL.
DISCLAIMER : I am NOT a SEBI registered advisor or a financial adviser. All the views are for educational purpose only.

REL Power : It has to clear the Red band Resistance REL Power : It has to clear the Red band Resistance to move forward.
This is 3M Time Frame.
( Not a Buy / Sell Recommendation
Do your own due diligence ,Market is subject to risks, This is my own view and for learning only .)

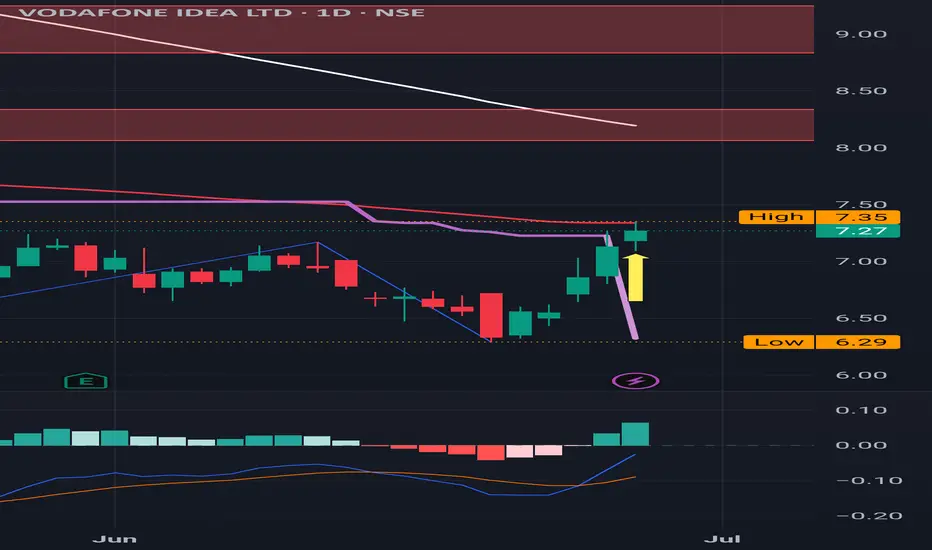
Vodafone Idea: Moving to a Buy trajectory
Vodafone Idea: Moving to a Buy trajectory
Recovered quite well from the support with back to back Greens as displayed on the Chart
Tough road ahead with multiple Red Band Resistances.
MACD is positive almost approaching an important level of 0.
( Not a Buy / Sell Recommendation
Do your own due diligence ,Market is subject to risks, This is my own view and for learning only .)
REL: Sitting at the major Red Band Resistance REL : Sitting at the major Red Band Resistance
It has to clear this to reach out to the important peak level of 1608 which happened last year almost the same time in July 2024 .
( Not a Buy / Sell Recommendation
Do your own due diligence ,Market is subject to risks, This is my own view and for learning only .)

shrirampiston buy @ 2400 , target 5000SHRIPISTON
> Cup and Handle breakout in progress.
> 📍Buy: ₹2400 | 🎯 Target: ₹5000 in 2–3 years
> Auto ancillaries quietly leading — multibagger setup alert!
> \#Multibagger #TechnicalAnalysis #AutoAncillary #SHRIPISTON

Sail : Approaching Near Resistance Sail : Approaching near Resistance
136 is the first resistance level to be watched out for and than major Red Band Resistance as displayed on the Chart
( Not a Buy / Sell Recommendation
Do your own due diligence ,Market is subject to risks, This is my own view and for learning only .)


RELIANCE Croosed resistance, strong sentiments supporting upmove. Strong trend reversal clearly visible in weekly timeframe.


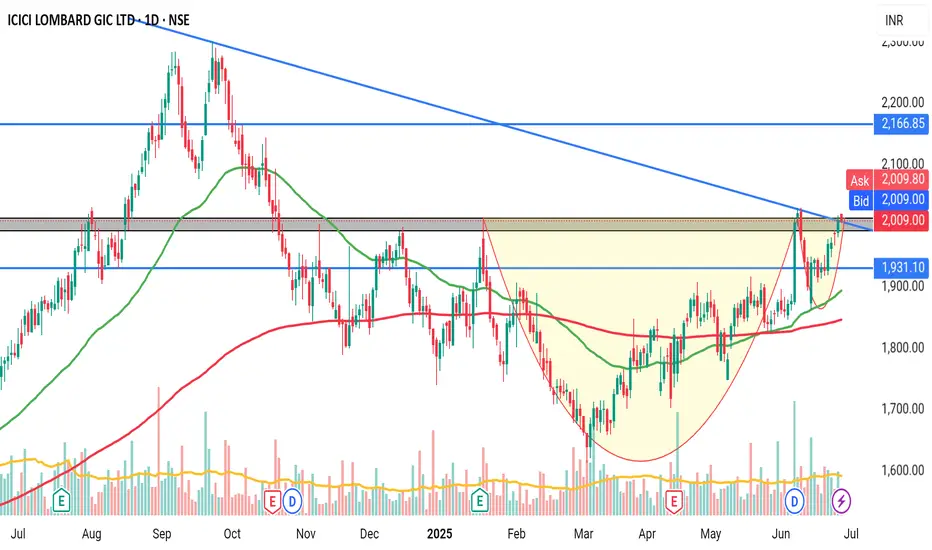
ICICI LOMBARDOn the verge of giving breakout of cup and handle pattern. If volume supports the breakout, it will shoot up in no time.
MOBIKWIKMOBIKWIK
watch above levels. green line is our entry, redline is our SL.
Current level also good.
DISCLAIMER : I am NOT a SEBI registered advisor or a financial adviser. All the views are for educational purpose only.
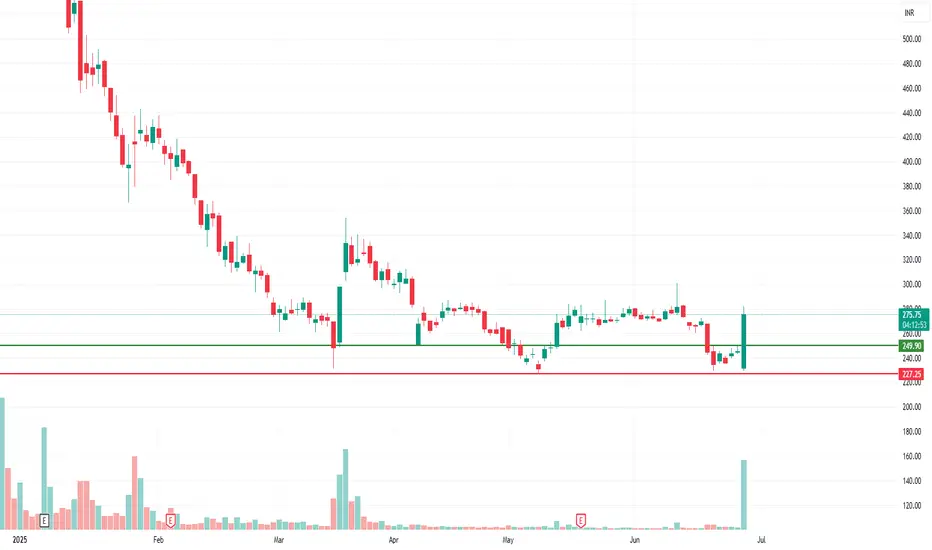
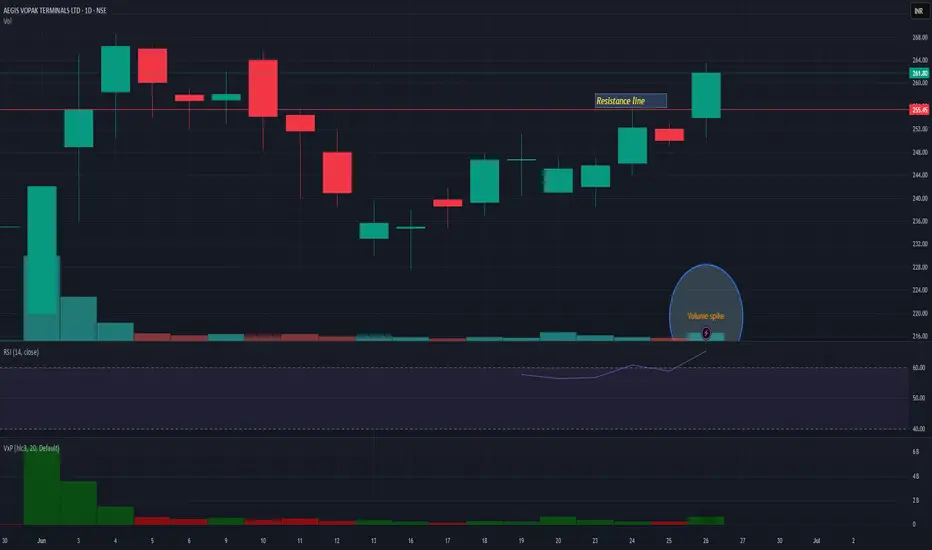
AEGISVOPAKAEGISVOPAK is coming out from small consolidation and giving decent volume today. 250 is very strong support. It may face next resistance nr 290 level.
SWIGGY – Rounded Bottom Breakout with Volume SurgePattern: Rounded bottom
Breakout level: ₹345
Current price: ₹355.55 (+6.71%)
Volume: 24.64M (above 20-day average of 20.91M)
RSI: 66.27 – strong bullish momentum
Target: ₹409 (18 percent upside)
Stop-loss: ₹324
Invalidation: Close below ₹340 with volume
Context:
A well-defined rounded base has broken out with strong follow-through. Volume exceeds the average, RSI confirms momentum, and the breakout candle shows no selling pressure. A bullish divergence in RSI had already signaled accumulation before price action confirmed it. Coverage initiation by Morgan Stanley aligns with, but does not drive, the technical breakout.
Disclaimer:
This analysis is intended for informational and educational purposes only and does not constitute financial, investment, or trading advice. Trading and investing in equities involve risk, including the risk of capital loss. The pattern recognition and breakout setup described here are based purely on technical chart analysis, without consideration of the company’s financial statements, earnings outlook, or valuation metrics. Market conditions can change rapidly, and price targets or stop-loss levels may not be respected under volatile scenarios. Always consult your financial advisor and conduct your own due diligence before making any investment decisions.

strong breakout candidate kronox lab sciences ltdstrong breakout candidate kronox lab sciences ltd
wait for retest and enter with small sl
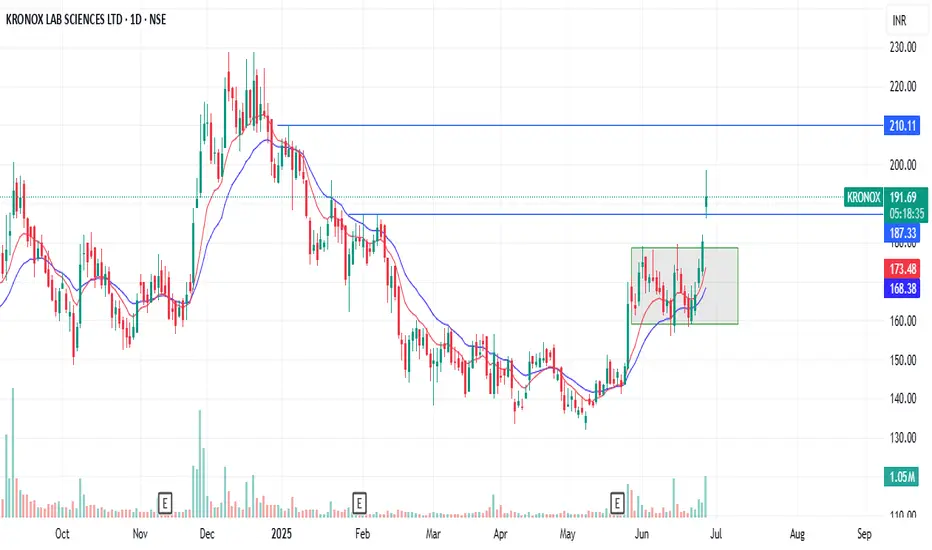
Kronox LabsThe stock appears to have bottomed at the 140s level.
It broke the bearish trend by surpassing the key 160 level, followed by a successful retest.
Currently, it is facing minor resistance around the 180 zone.
A breakout above 180 could pave the way for a new high, potentially targeting the 230+ levels.
I'm not SEBI registered. It is not a financial advice, just an idea.

JUBLPHARMARSI + Inside Bar Candle
RSI support taken @ 60
Inside Bar Candle level
Resistance 1172
Support 1090
Resistance 1195 Once cross
Then expected level 1309


JSL , 1W Pattern is looking soo good and it is ready to Breakout from this pattern ,
do not enter into this until it give a Good Weekly close , if you enter it can be a trap also , so enter after Confirmation and Risk according to your Capital .
Follow for More Swing Ideas Like this

AXIS BANK will touch 1273 than 1349 Soon.Axis bank is in Bull run with cup and handle pattern going to be finish and going to be touch last High soon.
