SUNDARAM FINANCE Near at Support Zone | Keep an eye on it ||There are two charts of Sundaram Finance —on the Weekly timeframe and Daily timeframe.
On the weekly timeframe, the stock is moving within an ascending parallel channel, with the support zone between 4650-4550.
On the daily timeframe, the stock is moving within a descending channel, with the support boundary near 4600-4650.
If this level is sustain then we may see higher prices in SUNDARMFIN
Thank You...

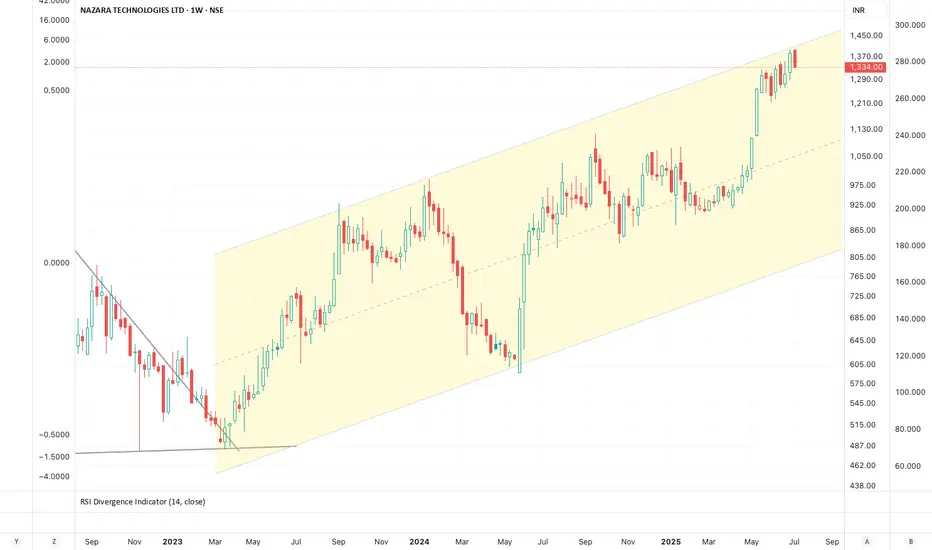
Nazara: na zaraNazara
PER 141
Rising Channel
Insiders selling
Volumes falling
Momentum Indicators overbought
Target
3 figures !!
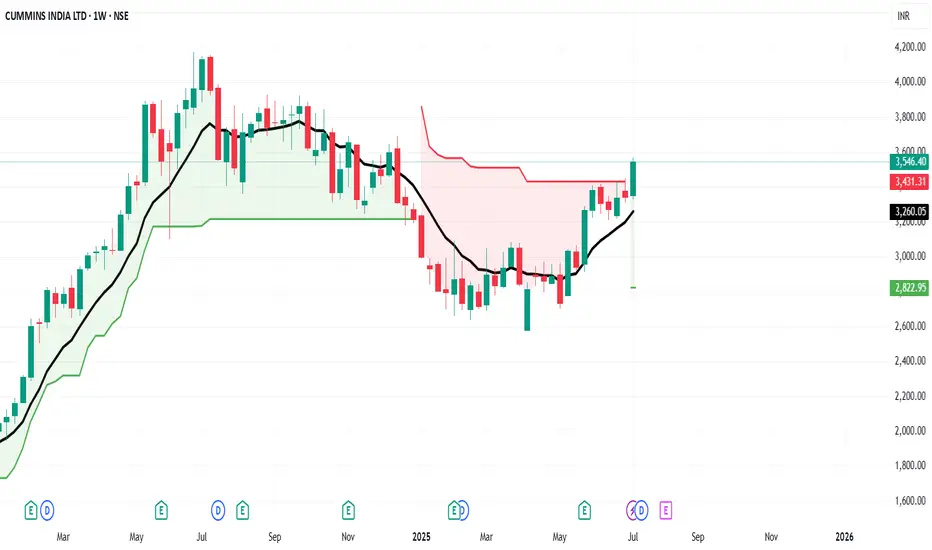
Long CUMMINSINDSuperTrend has turned positive on the weekly chart, with the recent closing price trading above the 10 EMA
BUY CUMMINSIND
Entry - 3570
SL - 3260
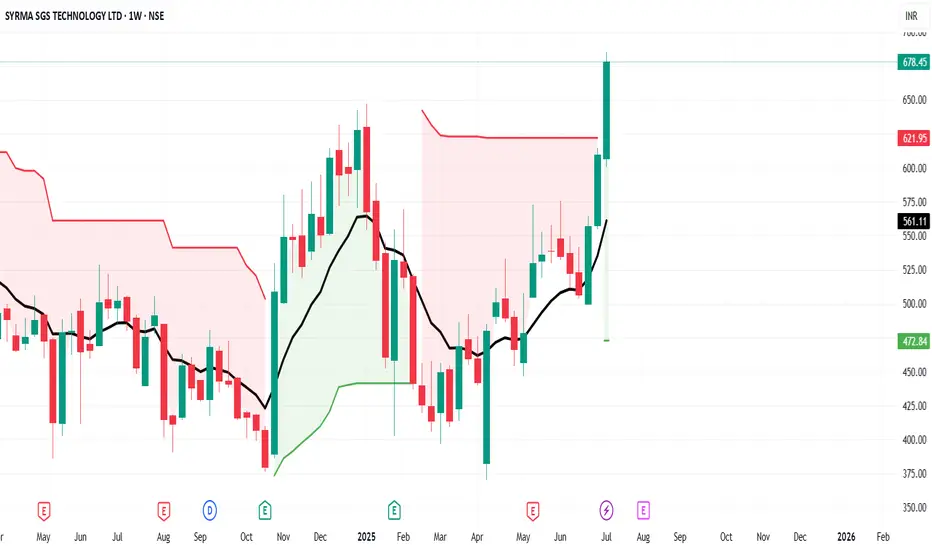
Long SYRMASuperTrend has turned positive on the weekly chart, with the recent closing price trading above the 10 EMA
BUY SYRMA
Entry - 686
SL - 560
Long ACMESOLARSuperTrend has turned positive on the weekly chart, with the recent closing price trading above the 10 EMA
BUY ACMESOLAR
Entry - 304
SL - 250

Long ANANDRATHISuperTrend has turned positive on the weekly chart, with the recent closing price trading above the 10 EMA
BUY ANANDRATHI
Entry - 2250
SL - 2015

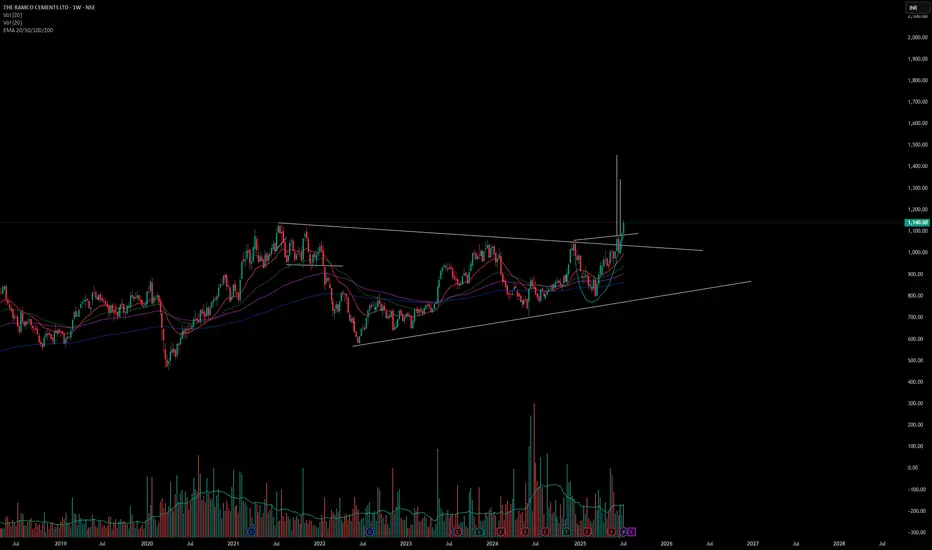
Long The Ramco Cements LTD . On 9/07/2025 I have shared this stock with all of you but very few people have seen this publish idea but today on 13/07/2025 I am sharing this stock with all of guys with weekely analysis of this stock. Its new target is 1450.
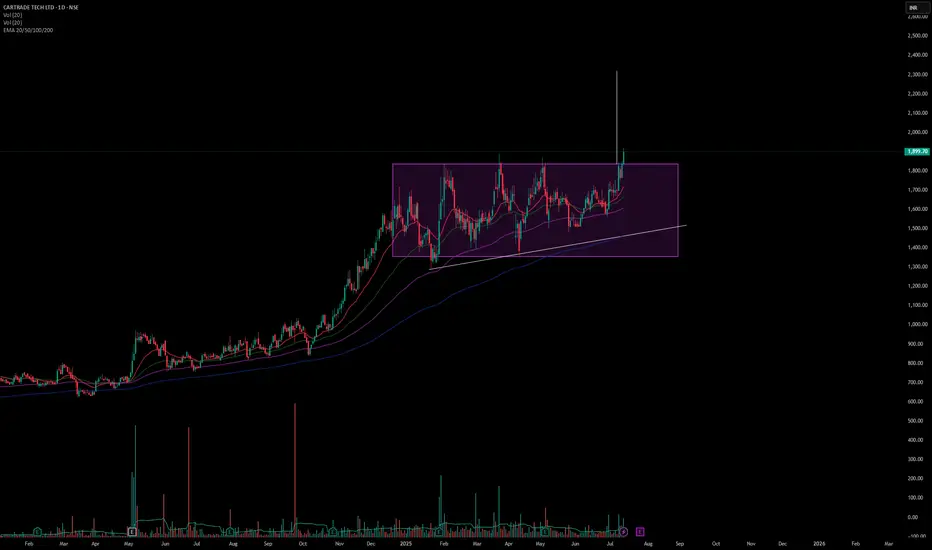
Long Cartrade Tech LTD . This stock has broken out of a rectangle pattern and trending at 1899.70. We can take a swing trade in this stock with an SL of 7.5% which will hit at 1750 and target of 22% which we will achieve at 2320. Our risk & reward ratio is 1:3.
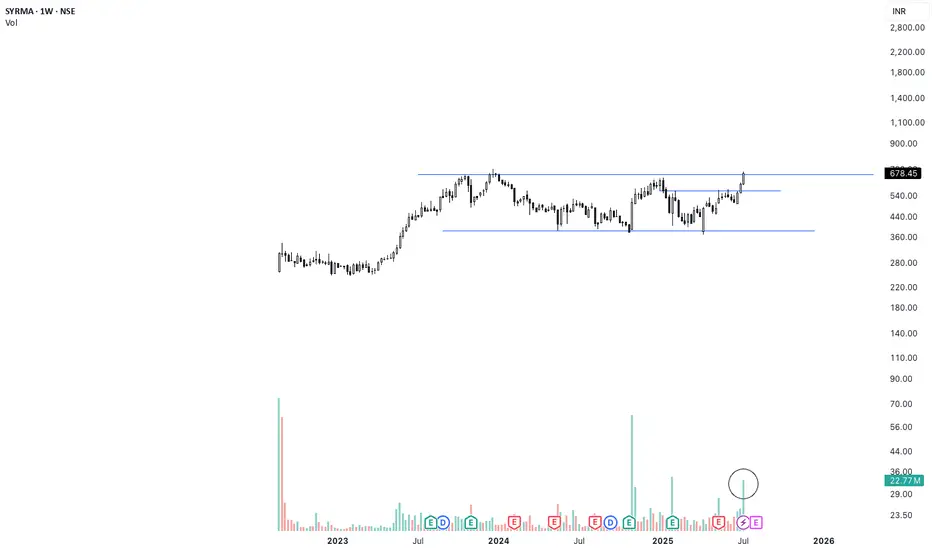
SYRMA Weekly Breakout | High Volume + 1.5-Year Base Structure🚨 Breakout Alert on SYRMA (Weekly)
After 1.5 years of sideways consolidation, SYRMA has finally broken out with strong conviction. The breakout is supported by the highest weekly volume seen in months — signaling smart money accumulation.
📊 Technical Setup:
🔹 1.5-year base formation now broken
🔹 Breakout candle closed above resistance with strength
🔹 Volume spike confirms breakout validity (HVE)
🔹 Structure resembles classic Stage 2 breakout
🟢 Ideal retest zone: ₹670–₹680
🛑 Support zone: ₹635–₹645
Fundamental Snapshot:
✅ Revenue: ₹2,000 Cr → ₹3,800 Cr in 2 years
✅ Net Profit up 50% YoY
✅ EPS (TTM): ₹9.57
✅ Promoter holding: ~46%
✅ Dominant player in EMS & IoT hardware
⚡Macro trend supports domestic electronics manufacturing — still early in the cycle.
Zydus Lifesciences Long_Support at 20 Daily EMAZydus Lifesciences Long:
- Clean Price action
- price takes support near 20 DEMA
- price test 20 DEMA for first time after Golden Crossover (50 > 200 DEMA)
- Hidden Bullish Divergence in action.
- Enter long when the prices are favorable
- SL: close below 20 DEMA

ICICI GI Long_Support at 20 Daily EMAICICI GI Long:
- Price takes support at 20 DEMA
- 2 days before the Earnings call (Caution)
- Enter long when the prices favorable in the lower timeframe
- SL: CLose below 20 DEMA

Nuvama Wealth 📈 Trade Setup:
Parameter Value
Entry Price ₹6,905
Stop Loss ₹6,643
Target ₹10,274
Risk ₹262
Reward ₹3,369
Risk:Reward 12.9x
Last High ₹8,551
Last Low ₹6,828
Point Variation ₹1,723
🧠 Interpretation:
Perfect Trend Alignment: UP across all HTFs, MTFs, and ITFs.
Entry is within weekly demand zone (6905–6374), giving a low-risk setup.
High R:R (12.9x) makes this a compelling swing trade opportunity.
Target of ₹10,274 implies a breakout beyond the previous high (₹8,551), anticipating new ATHs.
SL of ₹6,643 is below recent lows and strong demand zones—well positioned.
⚠️ Watchouts:
If 6828 breaks, revalidate strength — this is the last key support across multiple timeframes.
Monitor volumes and candle formations around 6900–7200 zone to confirm breakout momentum.
✅ Overall Trend: STRONG UPTREND
All timeframes — High Time Frame (HTF), Medium Time Frame (MTF), and Intraday Time Frame (ITF) — show consistent upward demand zones.
📊 Zone Summary:
Timeframe Trend Zone Type Proximal Distal Avg Zone
Yearly UP Support 5326 4454 4890
Half-Yearly UP Rally → Rally 5326 4454 4890
Quarterly UP Rally-Base-Rally 5326 4454 4890
Monthly UP BUFL 7241 6805 7023
Weekly UP BUFL 6905 6374 6640
Daily UP BUFL (DMIP) 7194 7034 7114
240M / 180M / 60M UP DMIP ~6882 ~6828 ~6941
Support zones are tightening as we move from higher to lower timeframes — showing strong buyer interest across levels.

ABDL looking good Another recent IPO. ABDL, Tightness and the ascending pattern...One big volume candle away from restart of the trend

EIEL Potential big winner? Monster candle, 12% up on heavy higher than avg volume, clean breakout from box.

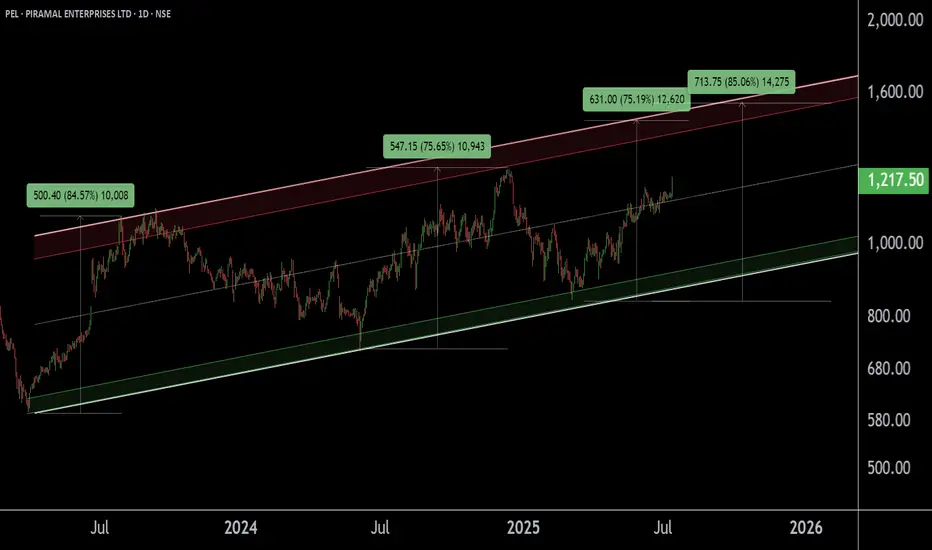
PEL !! PIRAMAL ENTERPRISES LTD appear to be in a Breakout phase This is the Daily Chart of PIRAMAL ENTERPRISES LTD.
PEL is trading above the midline of its ascending parallel channel, with strong support in the ₹1080–₹1150 zone. Historically, whenever it sustains above the midline, it tends to retest the upper boundary resistance of the channel near at 1500 -1540.
If this level is sustain then we may see higher prices in PEL.
Thank You !!

WAAREE PULLBACKAfter a series of higher lows, now punching above recent resistance ₹3,116 & pulling back slightly which is a typical strong breakout action and sector is linked to renewable energy/equipment; explosive EPS growth backs technical breakout.

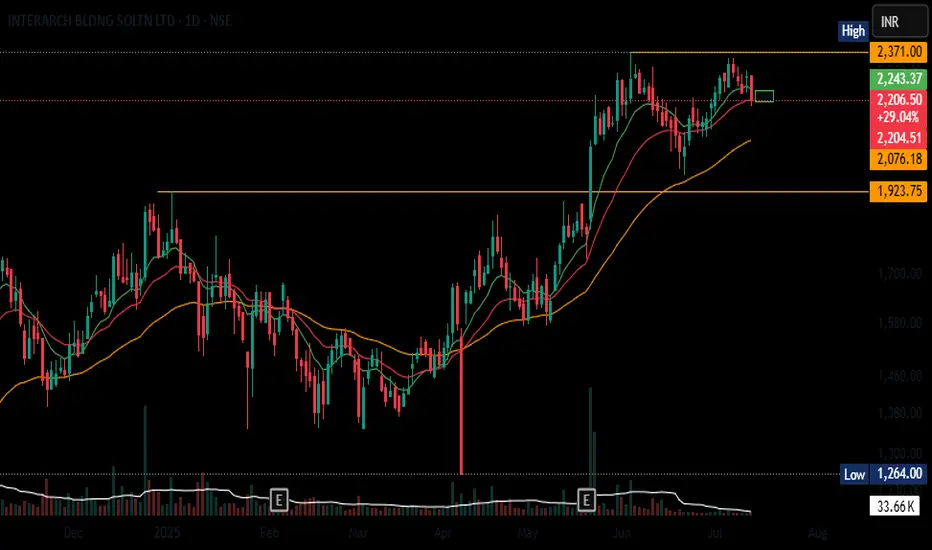
INTERARCH PULLBACK Clean break above prior resistance (₹2,371), now consolidating - A typical retest zone around breakout. Uptrend remains intact
TRANSRAIL PULLBACKBroke out near ₹787 (52-week high), now pulling back slightly — a typical consolidation above breakout. EMAs (50/200) trending up, Structurally strong and profitable; consolidation is natural, watch ₹718–724 zone for possible support.

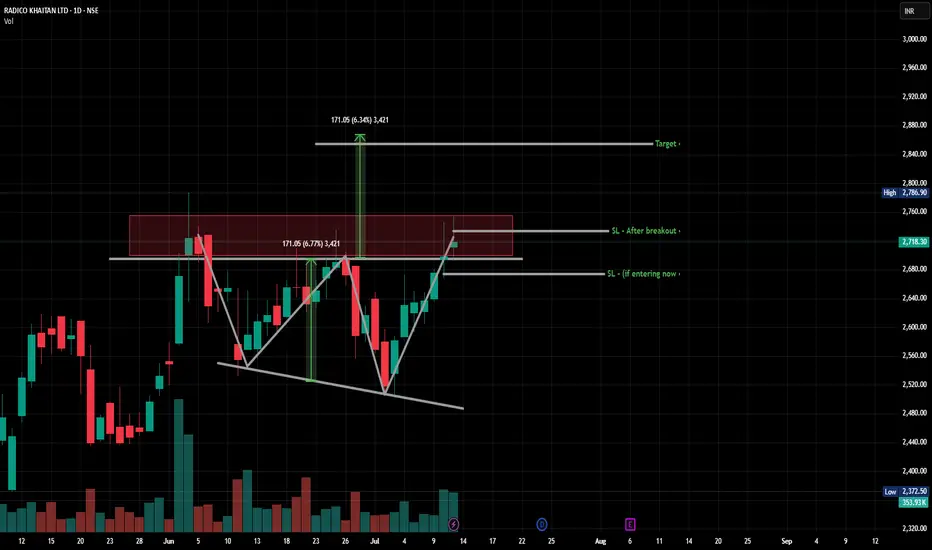
RADICO: Clean W patternNSE:RADICO : A clean W Pattern has formed. But it is kind of screwing up on the resistance. I am waiting till it maybe breaks out of that range because:
High volume
Not looking good :(
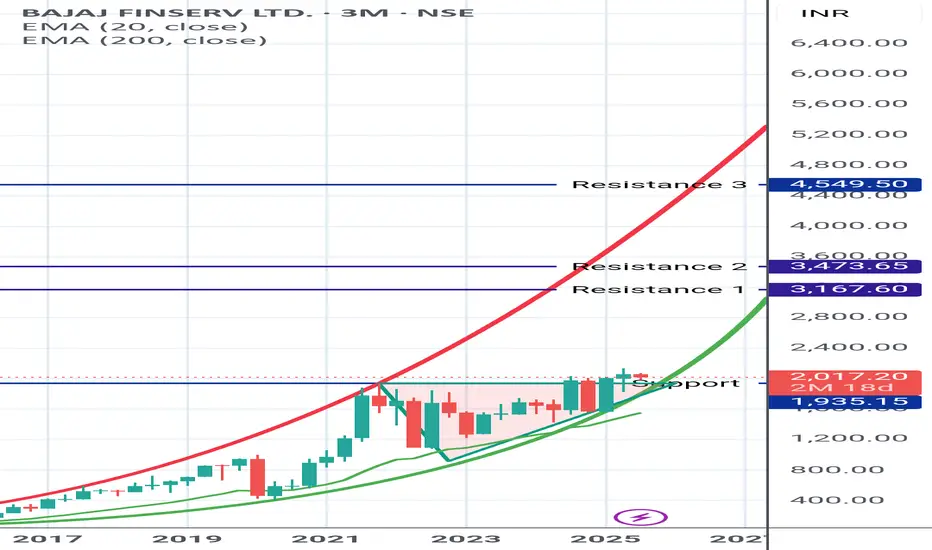
Baj Finserv Bajaj Finserv
looks good in Parabolic uptrend. Recently closed above the triangular marked zone and retesting it.
Can expect fresh rally.