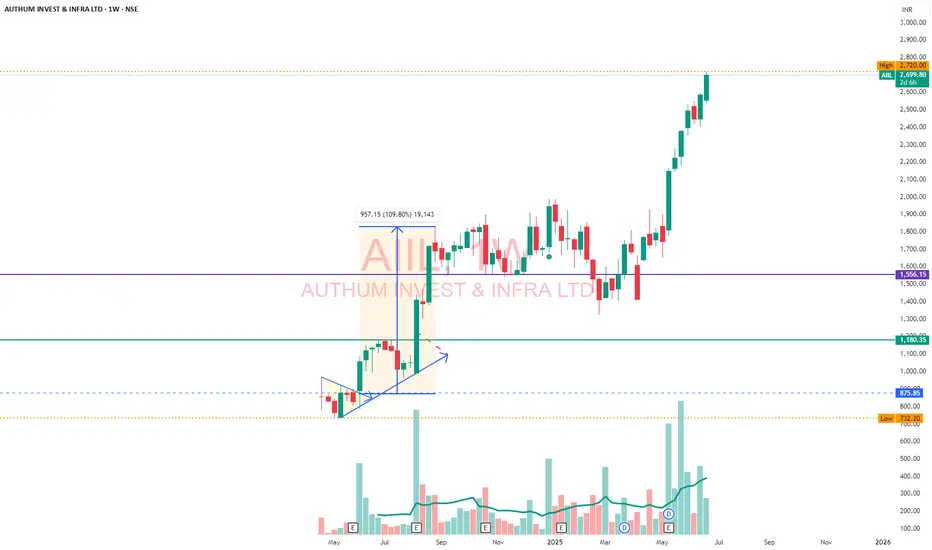
AIILAuthum Investment
This stock has been growing rapidly with good fundamental has given almost 300% return in a single year... I had suggested somewhere around 1180 and from that movement this stock has never overshadow and today made high of 2700, Soon this will be trading around 3000 within few days.. its a buy on Dip stock...
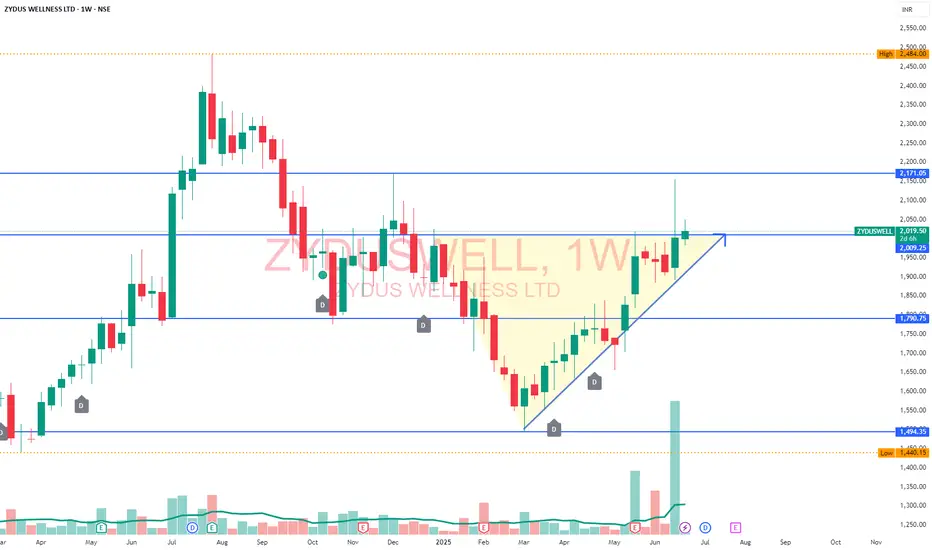
ZYDUSWELLZYDUSWELL
Buy this stock on current Price: 2016, Stock moving horizontal with potential breakout...The recent volume spike speaks loudly that it will tear up.
Accumulate if it goes below the trendline.
Target: 2050, 2100, 2150
Timeframe: Few Weeks.
Jsw Infra , 1WExpansion Channel is looking good , it is consolidating from One Year
Now it is ready to Breakout , wait for proper breakout to Happen
wait for string close above trendline
Follow for more Swing Ideas Like This

KEI in BreakoutNSE:KEI in Breakout. It has formed a Bullish flag Trend. 1st target would be 4000 and second Target would be 4200

POPULAR VEHICLES N SER L S/LSupport and Resistance Levels:
Support Levels: These are price points (green line/shade) where a downward trend may be halted due to a concentration of buying interest. Imagine them as a safety net where buyers step in, preventing further decline.
Resistance Levels: Conversely, resistance levels (red line/shade) are where upward trends might stall due to increased selling interest. They act like a ceiling where sellers come in to push prices down.
Breakouts:
Bullish Breakout: When the price moves above resistance, it often indicates strong buying interest and the potential for a continued uptrend. Traders may view this as a signal to buy or hold.
Bearish Breakout: When the price falls below support, it can signal strong selling interest and the potential for a continued downtrend. Traders might see this as a cue to sell or avoid buying.
MA Ribbon (EMA 20, EMA 50, EMA 100, EMA 200) :
Above EMA: If the stock price is above the EMA, it suggests a potential uptrend or bullish momentum.
Below EMA: If the stock price is below the EMA, it indicates a potential downtrend or bearish momentum.
Trendline: A trendline is a straight line drawn on a chart to represent the general direction of a data point set.
Uptrend Line: Drawn by connecting the lows in an upward trend. Indicates that the price is moving higher over time. Acts as a support level, where prices tend to bounce upward.
Downtrend Line: Drawn by connecting the highs in a downward trend. Indicates that the price is moving lower over time. It acts as a resistance level, where prices tend to drop.
Disclaimer:
I am not a SEBI registered. The information provided here is for learning purposes only and should not be interpreted as financial advice. Consider the broader market context and consult with a qualified financial advisor before making investment decisions.

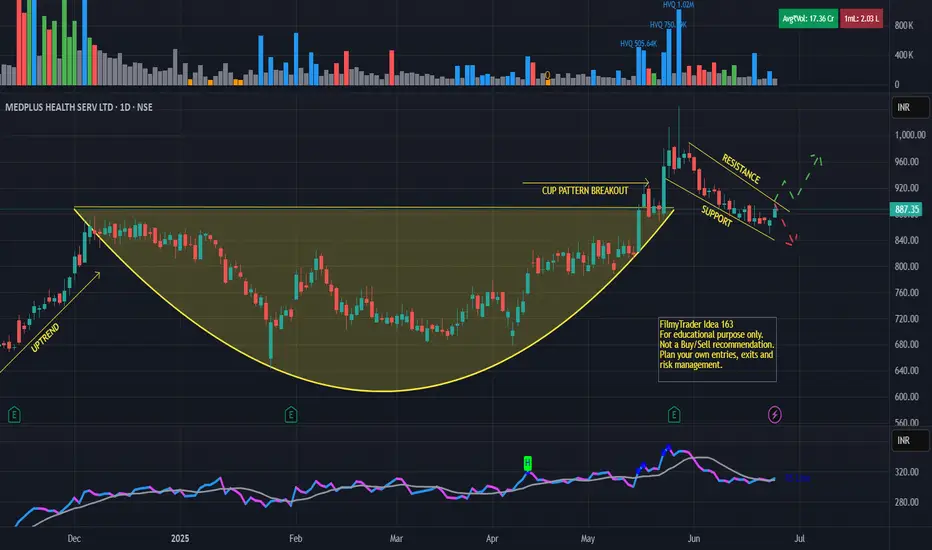
Medplus - Cup n Handle PatternMEDPLUS HEALTH SERV LTD
CUP N HANDLE pattern in daily timeframe.
Closing above previous high.
Stock outperforming benchmark and sectoral index.
PSAR indicating bullish trend.
Disclaimer:
For educational purpose only.
Please do your own research before taking any trades.
Happy Trading!
Positional Setup for Jio Financial Services Ltd (NSE)CMP: ₹300.80
Immediate Resistance: ₹306
Support Levels: ₹277 / ₹267 / ₹254
Structure: Rounded bottom breakout in progress after a prolonged downtrend recovery
Momentum Indicator: RSI near breakout confirmation, strength building
📈 Technical View (Positional)
Price is retesting key resistance at ₹306 — a breakout above this level may unlock a fresh upside rally.
Increasing volumes and bullish recovery from lows (~₹215) suggest accumulation.
Close above ₹306 (preferably with volume) will confirm the rounded bottom breakout.
🚀 Positional Levels:
Entry Range: ₹295–₹305 (on closing confirmation)
Target 1: ₹330
Target 2: ₹358
Target 3: ₹390
Stop-Loss (Closing Basis): ₹277

TTML Ready as Next Multibagger 332/ 410 long Term onlyTTML showing real good setup as per monthly counts as we can see in our counts
every dip is buying opportunity for long term investors
possible entry 48.44
open to test levels - 332 -410-537
next grand cycle suggests its good time as buy setup formation running now
if sustain current levels on monthly basis that can ensure that counts are correct
Elliot wave theory consist multiple forecasts depends upon price action various time degree levels
our counts may be wrong
please do your own analysis before you enter into any sort of trading
CHARTS PUBLISH to learn /understand EW method
only education based only
share your counts- lets learn together !!! cheers

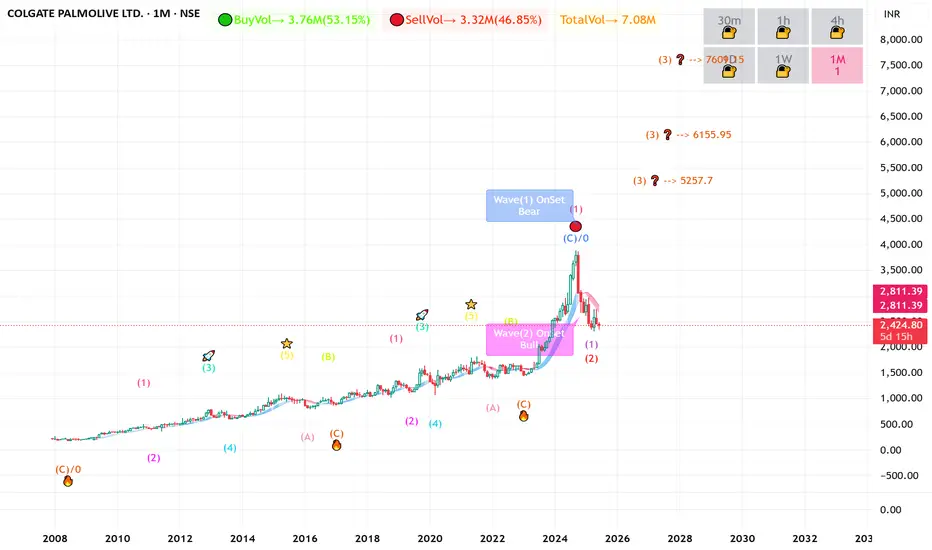
COLPAL Ready to Blast 5257 to 7601 long term investment ideaCOLPAL Monthly counts showing real good setup as per monthly counts as we can see in our chart showed to you
next grand cycle suggests its good time as buy setup formation running now
if sustain current levels on monthly basis that can ensure that counts are correct
Elliot wave theory consist multiple forecasts depends upon price action on various time degree levels
our counts may be wrong
please do your own analysis before you enter into any sort of trading
CHARTS PUBLISH to learn /understand EW method
only education based!!!
please share counts for this script
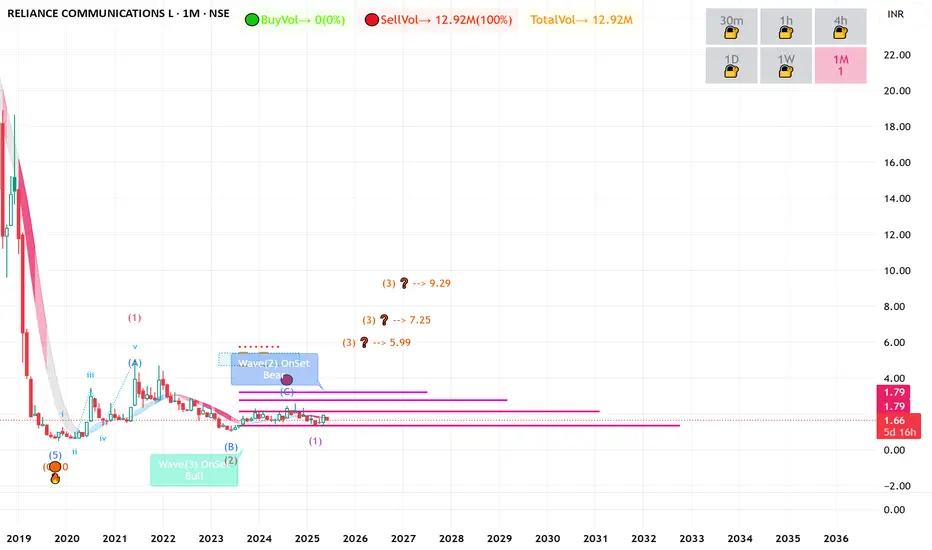
RCOM Big GEM ??? or just another bubbleReliance communication trading 1.55
we saw in monthly counts where we found big up setup in formation going on !!!
if wave theory exists than this could be big potential penny stock ready to blast with solid returns to investors for long term basis towards 7.55 to 9
Elliot waves theory consists multiple forecasts and moves
this is education-based charts share your counts!!!
LTF Price actionSO there is many change in character in the zone
firstly it moved upward and from the high of 196 the stock fell
it came near 180 to get some liquidity and then it it consolidated for a while
Then it gave a breakout, touched the level of 193 and later on again came to retest the level of 187.
After the breakout, it again came down to the level of 188. Then it gave us a trade rally of 5%.'

MCX - 5-Wave Impulse Complete, Correction Ahead?The recent price action in MCX has completed a 5-wave impulsive sequence, giving us valuable insights into potential upcoming moves.
The Larger Picture (Daily Timeframe) :
Starting from the prior major low, we have witnessed a clean impulse structure unfolding.
Wave 3 topped at 7,048.60, completing its previous impulse sequence.
Following this, a textbook ABC corrective structure unfolded into Wave 4, completing near 4,408.15. The internal symmetry within this ABC correction was near perfect, with Wave C nearly matching Wave A (100% projection).
Post Wave 4, the price resumed higher into Wave 5, where we now observe signs of completion.
Wave 5 Extension and Target Zone
Wave 5 extended strongly and has already entered its projected target zone:
100% projection of Wave 1 placed near 8,330.
1.618 extension projection reached near 8,922.
Ideal Correction Zones
Now that Wave 5 may have completed or is very close to doing so, we shift focus to probable retracement areas where price may find support in case of a corrective phase:
0.382 retracement at 6,853.50
0.5 retracement at 6,386.60
0.618 retracement at 5,919.65
Dynamic Update Note
The correction zones have been plotted based on the current observed Wave 5 high. Should Wave 5 extend further, these support levels will be recalculated accordingly. Traders are advised to keep monitoring for further price action confirmation before positioning.
The overall Elliott Wave structure here reflects the market may now enter a corrective phase as per standard wave behavior after a completed 5-wave advance.


#Nestle - Pivot Point is 2423.50 Date: 06-06-2025
#Nestle Current Price: 2415
Pivot Point: 2423.50 Support: 2378.05 Resistance: 2469.29
Upside Targets:
Target 1: 2513.39
Target 2: 2557.50
Target 3: 2607.75
Target 4: 2658.00
Downside Targets:
Target 1: 2333.78
Target 2: 2289.5
Target 3: 2239.25
Target 4: 2189.00

MAITHANLL - Simple Flag and Pole BreakoutWhen it comes to trading, i like to keep it simple.
Nothing fancy here, 50 DMA crossing over 200 DMA.
Trend line Breakout
Strong prior trend with good volumes, follow through happening today.
Keep 1120 as SL and trail

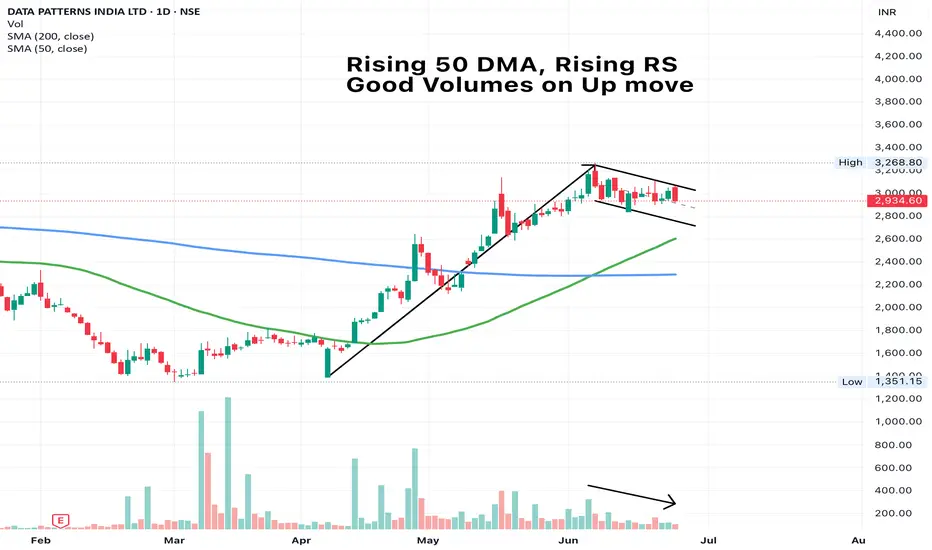
DATAPATTNS - Poised for a breakoutThoughts mentioned on charts. Simple 50 DMA rules work best always
Apollo Tyres BuyApollo Tyre seem to take support from its trend line.Buy @CMP (450) with a SL of 435 for a target of 475, 500 & 550

KINGS INFRAKINGS INFRA has formed a doji star in weekly pattern, by this weekend i expect this to finish as bullish hammer and that would eventually trigger a breakout . Very good position , enough of consolidation done and now it is ready to blast. Targets intact 2x returns is fairly possible.

ACC BuyACC shares seem to take support after breaking the channel resistance line. Buy @CMP (1850) with a SL of 1775 and target of 1950 & 2100.

Nath biogenesNATH BIOGENES, fresh charts here idicates a quick target of 235 and this target itself will trigger a fresh brèakout for 524. Hold it with patience , i have checked the company profile and it is excellent.

Jubilant Ingrevia Ltd Low Risk Entry Jubilant Ingrevia Ltd, on 2 weeks earlier, our Weekly Indicator give buy signal but that time Stop loss is much higher according to signal candle. But now it much lower.

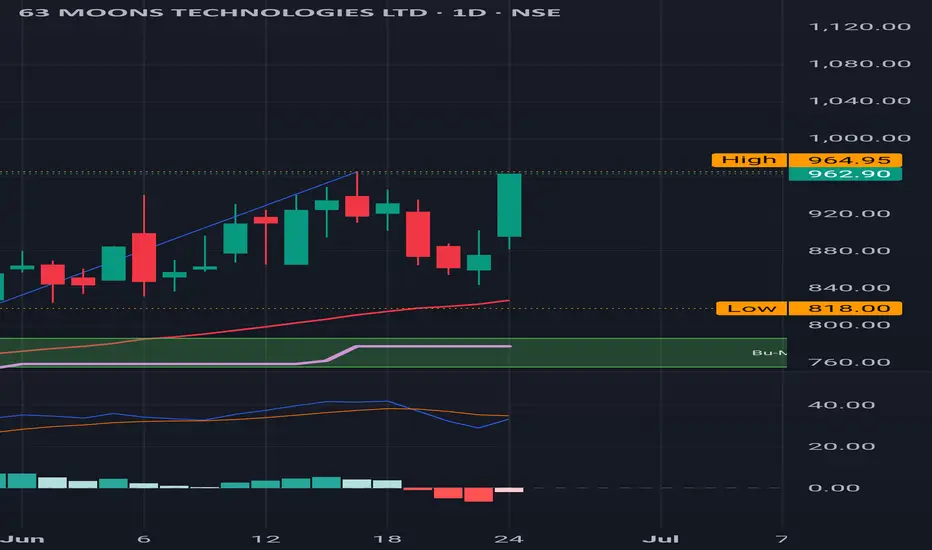
63 Moons : Sitting at the resistance 63 Moons : Sitting at the resistance.
If it clears this than the next level to be watched out for is 1000.
( Not a Buy / Sell Recommendation
Do your own due diligence ,Market is subject to risks, This is my own view and for learning only .)
Eicher Motors breaks?Eicher Motors breaks out of resistance with volume eyes set on the upper trendline near 6011.
After weeks of consolidation between 5250 and 5575, Eicher Motors has finally broken out of its sideways zone with strong follow-through and bullish intent.
Price not only cleared horizontal resistance but also pushed above the red supply zone around 5645, confirming buyer dominance.
This breakout aligns with the broader ascending channel that has been intact since March. The structure now hints at a potential continuation toward the upper channel line, projected near 6011 level highlighted risk-reward 1:3,
From a fundamental lens, Eicher has seen improved export numbers and rising traction in the premium segment, especially with Royal Enfield's increasing demand in overseas markets. If macro sentiment remains supportive, this technical breakout could be backed by earnings momentum in the upcoming quarters.
On the flip side, a failure to sustain above ₹5575 may drag the price back to test the breakout zone around ₹5430–₹5250.
Like, comment your thoughts, and share this post
Explore more stock ideas on the right hand side your feedback means a lot to me!
Disclaimer: This post is for educational purposes only and should not be considered a buy/sell recommendation.
