Is Consumer sector ready to roar?Stock Name: Bajaj Consumer
Resistance: 220 - 235
Support: 185
CMP: 202.90
Chart - Daily
Reason: After a very long time, the stock has given a turnaround reversal pattern called Horizontal Line breakout with a huge spike in volume, which has happened after almost 3 years.
Please note: This is only for study purposes before acting on any investment; kindly consult with your financial advisor.

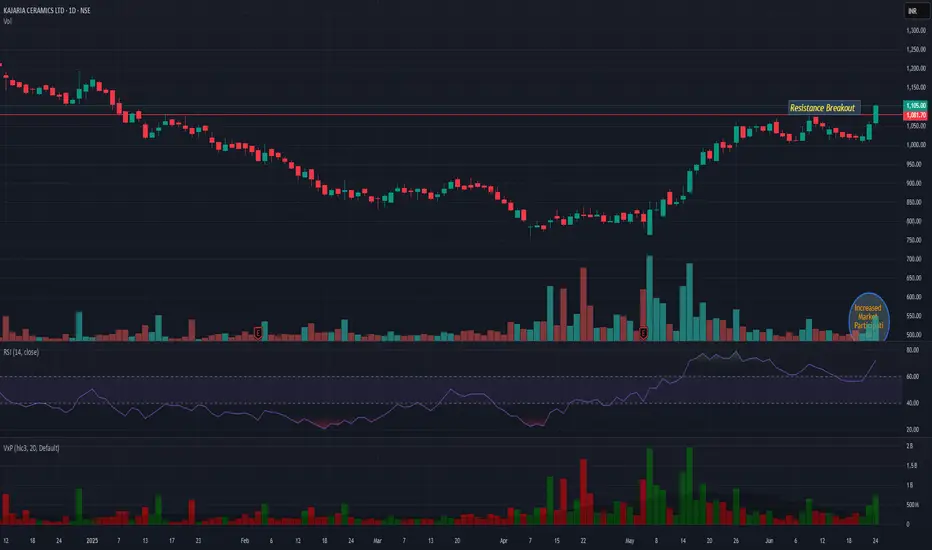
KAJARIACERKAJARIACER showing very good strength while giving breakout with decent market participation. 1050 is very good support. And upper side we may see continued momentum till 1215.
KINGS INFRAThe stock has consolidated enough for a brief period of time and in this period it posted healthy QoQ results. The stock belong to marine fishery domain and the entire domain is sluggish for now. This is now nearing breakout and it is a must buy for the mentioned target

SAIL at Best Support !!This is the 4 hour Chart of STEEL AUTHORITY OF INDIA .
SAIL having a good law of polarity at 125 range .
SAIL has formed a broadening pattern indicating the uptrend.
if this level is sustain then we may see higher prices in SAIL.
Thank You !!

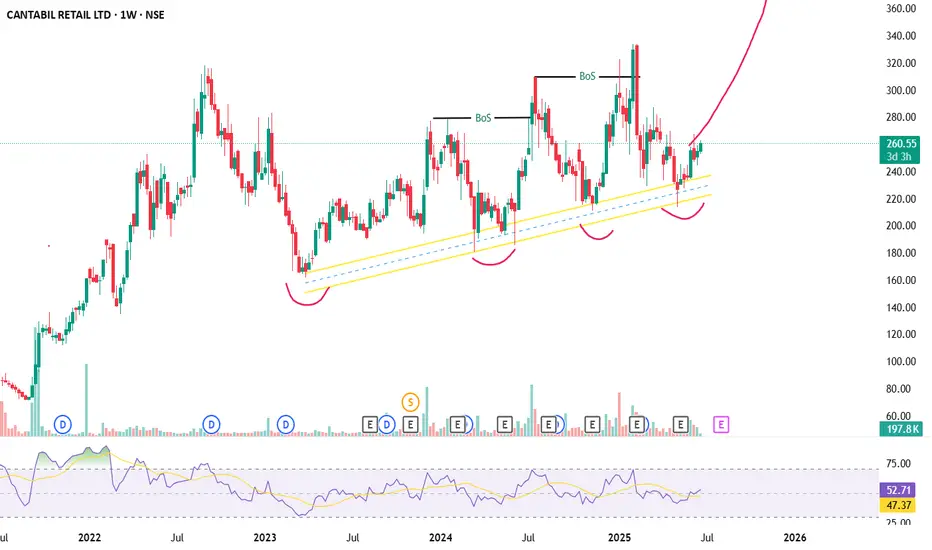
CANTABIL Long IdeaThe stock is already in an uptrend, following the trendlinel.Can go for a long position here
BAJAJ AUTO CMP 8400.(Positional,Investment porpose)After a long correction stock trading almost 30% discount from its all time high.It is a best opportunity.For long time players it is best time for entry in this stock.It giving a signal for bottom out with RSI comfirmation.Add this to your watchlist and see how it perform in coming days.

MAHARASHTRA SEAMLESSExcellent consolidation and movement on peiodic basis has resulted a beautiful formation. Fundamentally , this is a very good script and one should enter for long term as well. Right now, it is in very goood spot for accumulation in 678 to 689 range . Breakout is expected soon.

LemontreeThe stock has tested patience and at tge same time respected the charts
I am highly convinced that this stock will breakout and it would breakout huge, one 20% UC is highly expected followed by series of green candles eventually taking it to target of 178.

JKIL , Bullish A Very Good Pattern Breakout and come at Retest of Upper Trendline , and at Retest in 1D and Weekly supporting 20 EMA and Sustaining Above that , so we can Expect A Bullish Move in this Stock , As Nifty also giving good bullish move .
Follow for more Swing Ideas Like this
HDFC BANK - Will Go up?So my indian friends yet again has asked for this discretion, I feel the gap will be filled today or slow chop, the move is due to the ceasefire, since the last time i posted, it went very high

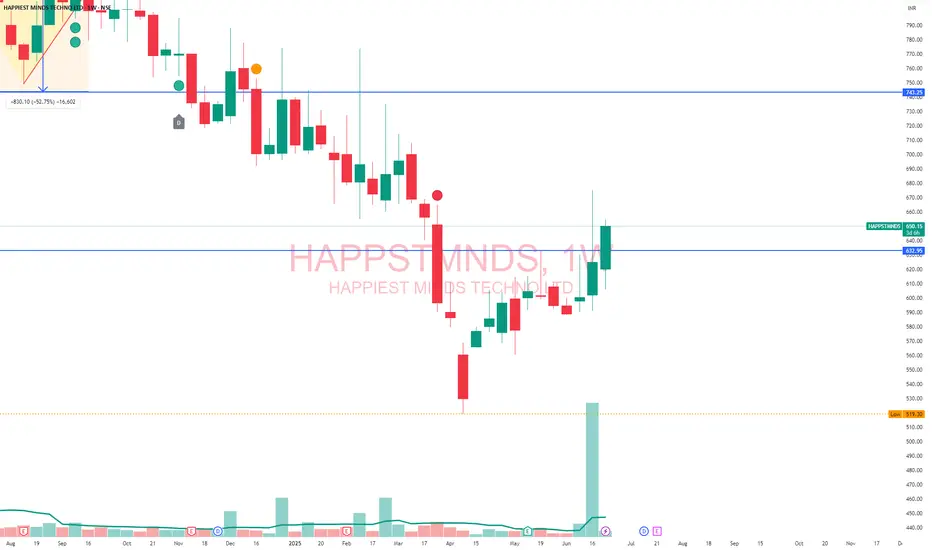
HAPPSTMNDSHAPPSTMNDS
Happiest Mind is look good for long position, Current Price is 650...
This stock has been having bearish fight since a long time.. now ready for blast..
Target: 700, 750, 800
Time Frame: Few Weeks.
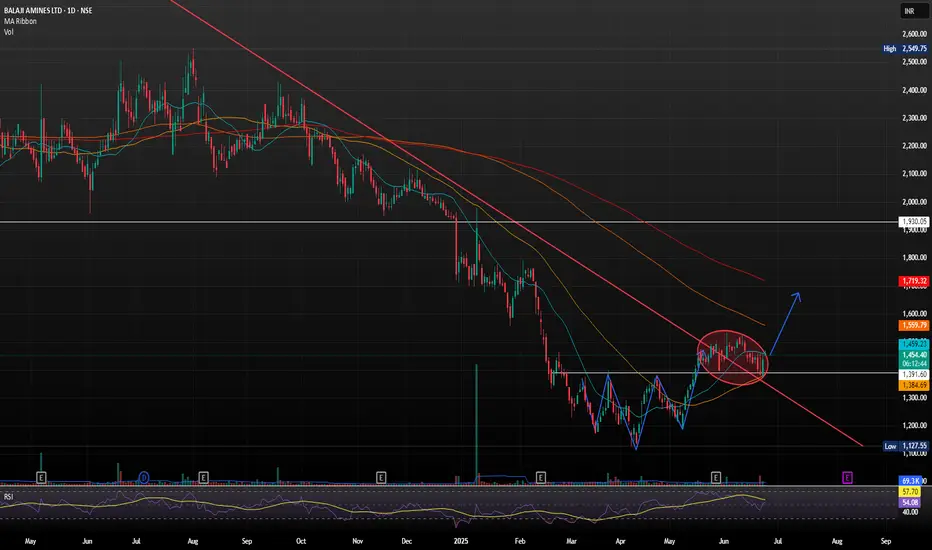
BALAJI AMINES PURE REVERSAL ON CHART.Balaji Amines Ltd. is a leading Indian chemical manufacturing company, primarily engaged in the production of methylamines, ethylamines, and their derivatives, along with specialty chemicals and pharma excipients. It holds a strong position in the aliphatic amines segment and is even the sole producer of certain specialty chemicals in India.
INVERSE HEAD & SHOULDER BREAKOUT AND CONSOLIDATION AT PULLBACKS SHOWS STRONG MOMENTUM FOR UPWARDS
A breakout above 1486 could trigger momentum toward 1524 and beyond towards 1775-1906
On the downside, keep an eye on support near 1330–1358.
SUBROSFew weeks back i got into this counter and realsied how well this stock is rising over years slowly and now , with a beautiful consolidation and accumulation , it is reafy for breaking out. I spotted it around 660 and had a target of 1010,. Surprisingly, the stock brokwput in 3 weeks time and a whopping rise of 48% witnessed. Right from 660 to 1020. Though i exited at 995, but the rally was so satisfying.


Advani hotelsStock has consoldated well on day chart and is a good bet for long term. On a shorter time fram, i speculate this to breakout just in 2 weeks time and it should hot the target of 104, almost 2x from currwnt price.

SOM DISTIL This is a beautiful script and it is exactly beahving the way it is supposed to, it will make higher highs and it will surely achive the target as marked in my charts. It is from the alcohol brewery group and the fundamentals are well in support with the charts.

Review and plan for 24th June 2025Nifty future and banknifty future analysis and intraday plan.
This video is for information/education purpose only. you are 100% responsible for any actions you take by reading/viewing this post.
please consult your financial advisor before taking any action.
----Vinaykumar hiremath, CMT

Spotted this beauty the day it finished consolidation Kinetic engg, was in beautiful spot and i was happpy to get grab it as i could see the atrget of 244 in this gloomg market. Bought it at 178
.both targets achieved.

PAYTM - The Stock to Watch - Classic VCP Formation - No AdvicePaytm with first contraction of about 30%, second contraction of about 13% tried to breakout on 2nd June but closing was not very convincing. It failed due to escalation in middle east crises. Now formaing a narrow base with volume also drying up. It is leading to the formation of classic VCP pattern and may lead to Minervini low pivot Cheat entry if closed above 896 with supporting volumes.

Adani Ports - My Pick, No Financial Advice or RecomendationStock is making HH & HLs, Taken first support at 50 DMA after golden crossover. Stock has also taken support at previous gap. Over all bullish. Close above 1373 with good volumes will tigger my entry. simple trade idea - no complex analysis.

TATAMOTORSi Observed these Levels based on Price Action and Demand & Supply which is my own Concept "PENDAM CONCEPTS"... Please don't take any trades based on this chart/post... Because this chart is for educational purpose only not for Buy or Sell Recommendation... Thank Q

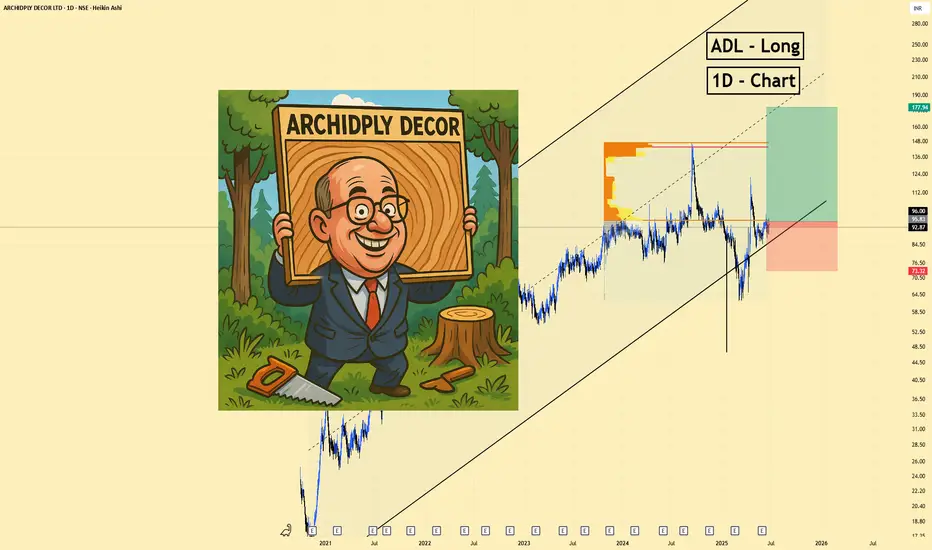
ADL | Direction: Neutral to Bullish | Valuation| (June 23, 2025 ADL | Direction: Neutral to Bullish | Key Reason: Valuation Re-rating Potential | (June 23, 2025)
1️⃣ Insight Summary
ADL is trading near its book value and showing modest sales growth. Although profits are very low, there's speculative potential if margins improve or the sector attracts investor attention.
2️⃣ Trade Parameters
Bias: Neutral to Long (speculative)
Check out the chart.
3️⃣ Key Notes
✅ Valuation – Trades close to book value, offering some downside cushion if fundamentals improve.
❌ Weak profitability – Earnings are almost flat; valuation appears stretched without consistent profits.
✅ Stable ownership – High promoter holding, no signs of aggressive leverage.
❌ Low liquidity – Very limited average trading volume may impact order execution and price volatility.
✅ Sector catalyst potential – If building materials or housing themes gain traction, small-cap names like ADL could benefit.
4️⃣ Follow-up Note
I’ll reassess this trade setup after upcoming earnings or on a confirmed break above current resistance with volume support.
Please LIKE 👍, FOLLOW ✅, SHARE 🙌 and COMMENT ✍ if you enjoy this idea! Also share your ideas and charts in the comments section below! This is the best way to keep it relevant, support us, keep the content here free and allow the idea to reach as many people as possible.
Disclaimer: This is not financial advice. Always conduct your own research. This content may include enhancements made using AI.