BEL_All time High_Potential Bullish Flag FormationWatch BEL
All time High with very high Volume.
Enter Small Quantity and ride the trend with tight SL

LICI_Long_Potential Positional PlayGOLDEN CROSS - 50 DEMA Crossess over 200 DEMA
First pull back to 20 DEMA after Golden Cross.
All Insurance Companies shows some positive Momentum.
Price takes support at 20 Daily EMA.
Worth taking LONG when lower timeframe is favorable.
THING TO NOTICE - Even if the price gaps up or down, price visits previous day's range.
(It will give attractive entry)

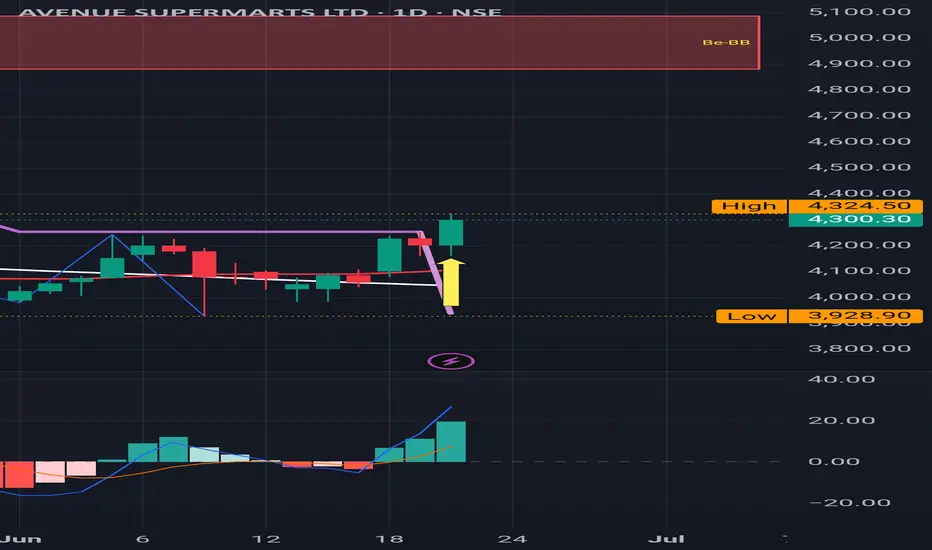
DMART : Buy Triggered DMART : Buy Triggered
First resistsnce level to be watched out for is at 4560.
( Not a Buy / Sell Recommendation
Do your own due diligence ,Market is subject to risks, This is my own view and for learning only .)
BEL : Flying High, creating new Highs.BEL : Flying High, creating new Highs.
After a Buy Signal as displayed on Chart , it never looked back .
3 Months Time Frame Chart .
( Not a Buy / Sell Recommendation
Do your own due diligence ,Market is subject to risks, This is my own view and for learning only .)

RELIANCE INDUSTRIES LTD On Daily RELIANCE INDUSTRIES LTD on Daily Timeframe, Our Daily Indicator give Signals early before.
Now on weekly as i posted earlier it also show buy signal. You can trade according to upper resistance line and ADR% shown on chart

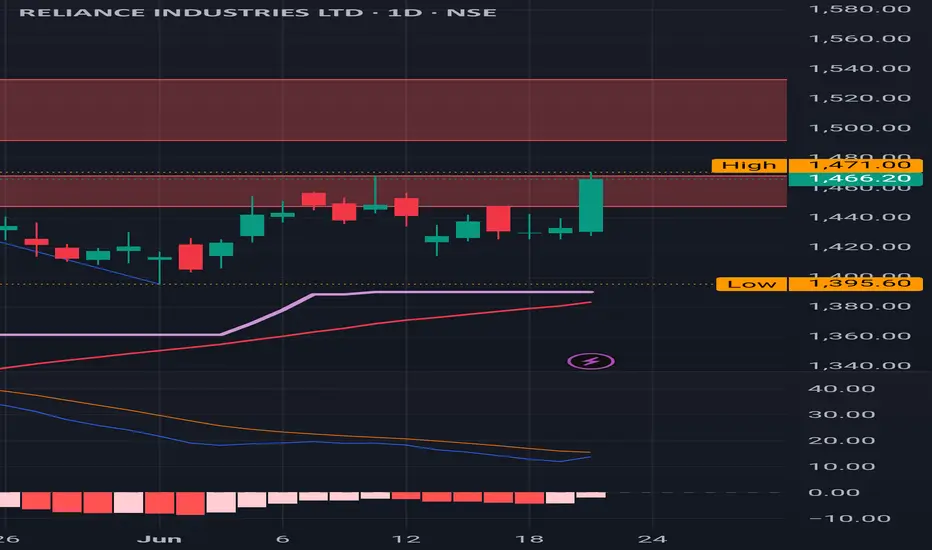
Reliance _ Long _ Bullish Flag FormationPotential Flag Formation
Price on the verge of breakout with very good volume.
Support taken at 20 DEMA as well.
Observe tomorrow, how the price reacts.
Enter Long only when the prices are favourable in the lower timeframe.

Reliance : Sitting at the Red Band Resistance
Reliance : Sitting at the major Red Band Resistance.
( Not a Buy / Sell Recommendation
Do your own due diligence ,Market is subject to risks, This is my own view and for learning only .)
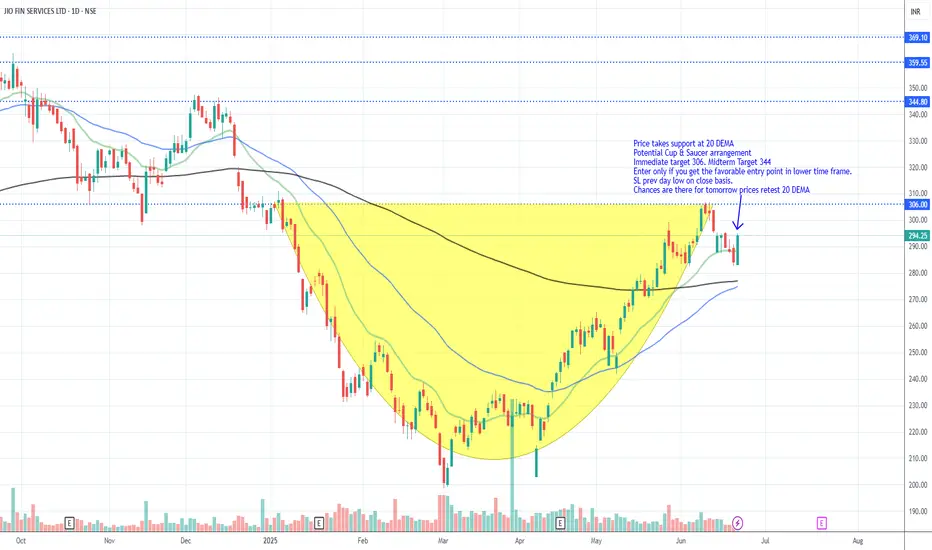
JIOFIN_Long_Wait for EntryPrice takes support at 20 DEMA
Potential Cup & Saucer arrangement
Immediate target 306. Midterm Target 344
Enter only if you get the favorable entry point in lower time frame.
SL prev day low on close basis.
Chances are there for tomorrow prices retest 20 DEMA

NRB Bearing Limited - 290 CMP Short-term Looking good for 100%+Good Buy For Short- Term 1 Year Investment Horizon.
NRB Bearing Limited - 290 CMP
Expected Return - 580 (100)%
Drawdown - 205 (35%)
*This POST for educational purpose only. Concern your advisor before investing in market related instrument...*
- AB_INV_7

NTPC📈 Trade Setup: BUY at 338
Parameter Value
Entry Price 338
Stop Loss (SL) 323
Risk 15
Target 494
Reward 156
Risk:Reward (RR) 10.4
Last High 448
Last Low 292
✅ Trade Interpretation
Entry Zone (338) is exactly at Weekly & Daily Demand.
SL (323) is just below this demand zone – protects from fake breakdowns.
Target (494) is ambitious, well above the previous high of 448, suggesting a potential breakout trade.
Risk-Reward Ratio (10.4) is exceptional – highly favorable trade.
📌 Key Observations
Stacked Demand Zones across all timeframes (from 323 to 338) give confidence in entry.
Momentum alignment across all timeframes (HTF, MTF, ITF) → indicates trend continuation.
Target (494) is logical if price breaks above last high (448) – breakout + momentum.
🔔 Suggested Strategy:
Entry near 334–338 zone, preferably on a bullish confirmation candle.
Trail SL once price crosses 360–380 range (monthly midpoint).
Partial booking near 448, and hold for extended target 494 if strength continues.
🔍 Multi-Timeframe (MTF) Analysis – NTPC
🔸 Higher Time Frame (HTF)
Trend: Strong UP across all (Yearly, Half-Yearly, Quarterly)
Key Demand Zones:
Yearly & Half-Yearly: 315–292 (Avg ~305)
Quarterly: 393–296 (Avg: 345)
HTF Average Demand Zone: 341–295, Avg 318
Interpretation: Robust long-term support zones, especially with demand logic and breakout structures forming.
🔸 Medium Time Frame (MTF)
Trend: All UP (Monthly, Weekly, Daily)
Zones:
Monthly: 360–296 (Avg: 328)
Weekly: 338–323 (Avg: 331)
Daily: 338–323 (Avg: 329)
These are all tightly stacked → indicates strong short- to mid-term support at 323–338.
🔸 Intraday Time Frame (ITF)
Trend: All UP (240M, 180M, 60M)
All have the same zone: 334–323 (Avg: 329)
Supports the entry zone very well — short-term traders are aligned with higher timeframe momentum.

BAJAJ FINANCE📈 Trade Setup
Parameter Value
Entry 878
Stop Loss (SL) 860
Risk 18
Target 1016
Reward 138
Risk:Reward (RR) 7.7
Last High 978
Last Low 840
✅ Trade Interpretation
Entry at 878 sits inside Daily & Intraday Demand Zone (878–860) → good support.
Stop Loss at 860 is below demand zone → protects against breakdown.
Target 1016 is conservative and achievable based on previous price behavior and a breakout above the last high of 978.
RR of 7.7 is excellent—well above minimum acceptable trading standards (typically >2.0).
📌 Key Insights:
All MTFs indicate bullish trend and stacked demand zones.
Entry plan is logical with favorable risk-reward.
Ideal setup for swing trade or short-term positional if overall market sentiment is neutral to positive.
🔍 Multi-Timeframe (MTF) Analysis Overview
🔸 Higher Time Frame (HTF)
Trend: UP across Yearly, Half-Yearly, and Quarterly
Support Zones:
Yearly & Half-Yearly: 782–642 (Avg: 712)
Quarterly: 820–666 (Avg: 743)
HTF Avg Demand Zone: 795–650 (Avg: 722) → Strong Long-Term Support
🔸 Medium Time Frame (MTF)
Trend: UP across Monthly, Weekly, Daily
Demand Zones:
Monthly: 825–778 (Avg: 802)
Weekly: 892–846 (Avg: 869)
Daily: 878–860 (Avg: 869)
MTF Avg: 691 (This seems like a placeholder or a misentry since zones are in 800+ range)
🔸 Intraday Time Frame (ITF)
Trend: UP across 240M, 180M, 60M
Demand Zone (common): 878–860 (Avg: 869)
ITF Avg: 691 (Again, this value doesn't match the actual average; likely a placeholder)

Max Health Care - VCP trade Idea - No Financial AdviceMax Healthcare is showing VCP pattern Breakout and retest. First Correction was deep upto -22.71 %, followed by second Correction of -11.91% and third correction of 7.12% approx before it finally breakout. Market has tendency to trap breakout traders therefore it again retraced below breakout candle for final sucessfull retest on 20 June. Fundamentally stock is good but given the recent turn of world events i.e., USA entry in middle east crises, I am conservative in my apporach and looking for one more small base formation before I make final entry in stock with proper risk management.

HUDCO LONG TERM ANALYSISThanks for stopping by.
All analysis here is done strictly from an investor’s perspective — focusing on risk, return, valuation, and potential upside.
The notes cover key details. I’ve backed every thesis with my own analysis — no fluff, just what matters to investors.
If you find the idea useful or have suggestions, feel free to leave a comment. Always open to fresh insights.
Kind regards,
Psycho Trader

IRFC - Its my Pick and not a Financial advice or recomendadtionThis stock is though trading below 200 DMA but it has started making HH and HL. It is currently resting at previous support along with 50 DMA. I may enter the trade with proper risk management with stock closes above 137 with good volume. Sl being 131 and target of 153.

Infosys with Cup and Handle chart pattern Infosys on daily get Buy signal from our Private Indicator and also forming a low pivot cup and handle chart pattern.
Buy and set stop loss according to ADR% shown on chart.

Canara Bank - Its not recommendation or Financial Advice Certainly I am bullish on Canara Bank as stock took its 1st support on 50 DMA after golden cross. Looking Backwards - its also breached previous support / Previous logical SL and closed above it.
I may enter after proper confirmation and with proper risk management

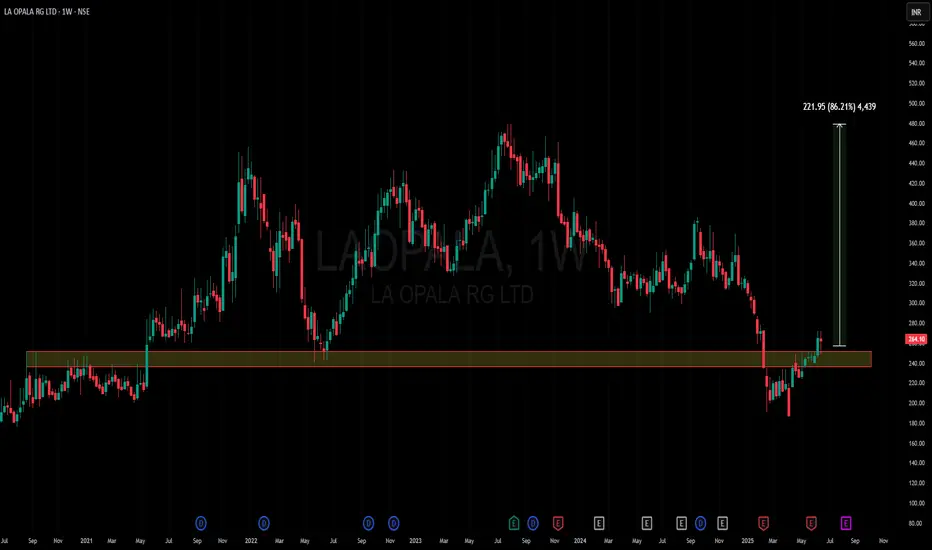
Amazing breakout on WEEKLY Timeframe - LAOPALACheckout an amazing breakout happened in the stock in Weekly timeframe, macroscopically seen in Daily timeframe. Having a great favor that the stock might be bullish expecting a staggering returns of minimum 25% TGT. IMPORTANT BREAKOUT LEVELS ARE ALWAYS RESPECTED!
NOTE for learners: Place the breakout levels as per the chart shared and track it yourself to get amazed!!
#No complicated chart patterns
#No big big indicators
#No Excel sheet or number magics
TRADE IDEA: WAIT FOR THE STOCK TO BREAKOUT IN WEEKLY TIMEFRAME ABOVE THIS LEVEL.
Checkout an amazing breakout happened in the stock in Weekly timeframe.
Breakouts happening in longer timeframe is way more powerful than the breakouts seen in Daily timeframe. You can blindly invest once the weekly candle closes above the breakout line and stay invested forever. Also these stocks breakouts are lifelong predictions, it means technically these breakouts happen giving more returns in the longer runs. Hence, even when the scrip makes a loss of 10% / 20% / 30% / 50%, the stock will regain and turn around. Once they again enter the same breakout level, they will flyyyyyyyyyyyy like a ROCKET if held in the portfolio in the longer run.
Time makes money, GREEDY & EGO will not make money.
Also, magically these breakouts tend to prove that the companies turn around and fundamentally becoming strong. Also the magic happens when more diversification is done in various sectors under various scripts with equal money invested in each N500 scripts.
The real deal is when to purchase and where to purchase the stock. That is where Breakout study comes into play.
Check this stock which has made an all time low and high chances that it makes a "V" shaped recovery.
> Taking support at last years support or breakout level
> High chances that it reverses from this point.
> Volume dried up badly in last few months / days.
> Very high suspicion based analysis and not based on chart patterns / candle patterns deeply.
> VALUABLE STOCK AVAILABLE AT A DISCOUNTED PRICE
> OPPURTUNITY TO ACCUMULATE ADEQUATE QUANTITY
> MARKET AFTER A CORRECTION / PANIC FALL TO MAKE GOOD INVESTMENT
DISCLAIMER : This is just for educational purpose. This type of analysis is equivalent to catching a falling knife. If you are a warrior, you throw all the knives back else you will be sorrow if it hits SL. Make sure to do your analysis well. This type of analysis only suits high risks investor and whose is willing to throw all the knives above irrespective of any sectoral rotation. BE VERY CAUTIOUS AS IT IS EXTREME BOTTOM FISHING.
HOWEVER, THIS IS HOW MULTIBAGGERS ARE CAUGHT !
STOCK IS AT RIGHT PE / RIGHT EVALUATION / MORE ROAD TO GROW / CORRECTED IV / EXCELLENT BOOKS / USING MARKET CRASH AS AN OPPURTUNITY / EPS AT SKY.
LET'S PUMP IN SOME MONEY AND REVOLUTIONIZE THE NATION'S ECONOMY!
Amazing breakout on WEEKLY Timeframe - RAMAPHOCheckout an amazing breakout happened in the stock in Weekly timeframe, macroscopically seen in Daily timeframe. Having a great favor that the stock might be bullish expecting a staggering returns of minimum 25% TGT. IMPORTANT BREAKOUT LEVELS ARE ALWAYS RESPECTED!
NOTE for learners: Place the breakout levels as per the chart shared and track it yourself to get amazed!!
#No complicated chart patterns
#No big big indicators
#No Excel sheet or number magics
TRADE IDEA: WAIT FOR THE STOCK TO BREAKOUT IN WEEKLY TIMEFRAME ABOVE THIS LEVEL.
Checkout an amazing breakout happened in the stock in Weekly timeframe.
Breakouts happening in longer timeframe is way more powerful than the breakouts seen in Daily timeframe. You can blindly invest once the weekly candle closes above the breakout line and stay invested forever. Also these stocks breakouts are lifelong predictions, it means technically these breakouts happen giving more returns in the longer runs. Hence, even when the scrip makes a loss of 10% / 20% / 30% / 50%, the stock will regain and turn around. Once they again enter the same breakout level, they will flyyyyyyyyyyyy like a ROCKET if held in the portfolio in the longer run.
Time makes money, GREEDY & EGO will not make money.
Also, magically these breakouts tend to prove that the companies turn around and fundamentally becoming strong. Also the magic happens when more diversification is done in various sectors under various scripts with equal money invested in each N500 scripts.
The real deal is when to purchase and where to purchase the stock. That is where Breakout study comes into play.
Check this stock which has made an all time low and high chances that it makes a "V" shaped recovery.
> Taking support at last years support or breakout level
> High chances that it reverses from this point.
> Volume dried up badly in last few months / days.
> Very high suspicion based analysis and not based on chart patterns / candle patterns deeply.
> VALUABLE STOCK AVAILABLE AT A DISCOUNTED PRICE
> OPPURTUNITY TO ACCUMULATE ADEQUATE QUANTITY
> MARKET AFTER A CORRECTION / PANIC FALL TO MAKE GOOD INVESTMENT
DISCLAIMER : This is just for educational purpose. This type of analysis is equivalent to catching a falling knife. If you are a warrior, you throw all the knives back else you will be sorrow if it hits SL. Make sure to do your analysis well. This type of analysis only suits high risks investor and whose is willing to throw all the knives above irrespective of any sectoral rotation. BE VERY CAUTIOUS AS IT IS EXTREME BOTTOM FISHING.
HOWEVER, THIS IS HOW MULTIBAGGERS ARE CAUGHT !
STOCK IS AT RIGHT PE / RIGHT EVALUATION / MORE ROAD TO GROW / CORRECTED IV / EXCELLENT BOOKS / USING MARKET CRASH AS AN OPPURTUNITY / EPS AT SKY.
LET'S PUMP IN SOME MONEY AND REVOLUTIONIZE THE NATION'S ECONOMY!

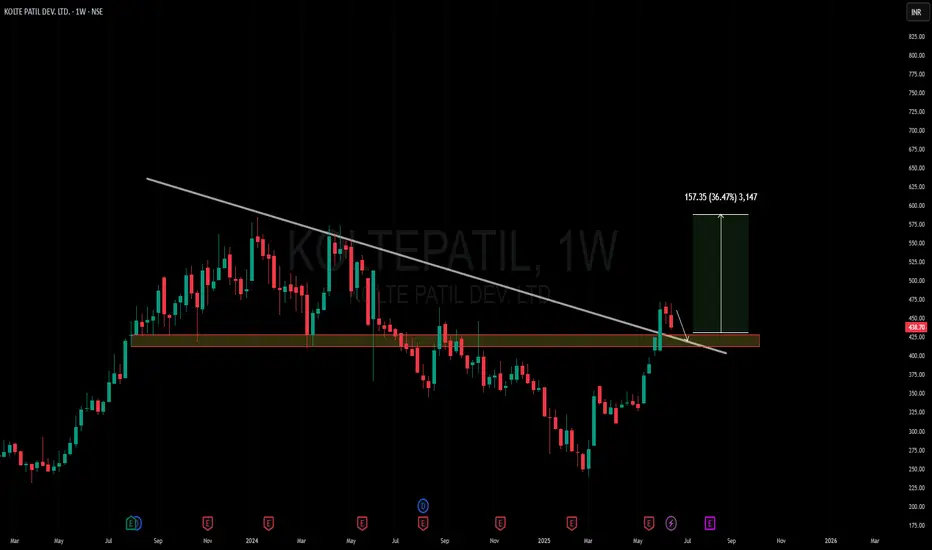
Amazing breakout on WEEKLY Timeframe - KOLTEPATILCheckout an amazing breakout happened in the stock in Weekly timeframe, macroscopically seen in Daily timeframe. Having a great favor that the stock might be bullish expecting a staggering returns of minimum 25% TGT. IMPORTANT BREAKOUT LEVELS ARE ALWAYS RESPECTED!
NOTE for learners: Place the breakout levels as per the chart shared and track it yourself to get amazed!!
#No complicated chart patterns
#No big big indicators
#No Excel sheet or number magics
TRADE IDEA: WAIT FOR THE STOCK TO BREAKOUT IN WEEKLY TIMEFRAME ABOVE THIS LEVEL.
Checkout an amazing breakout happened in the stock in Weekly timeframe.
Breakouts happening in longer timeframe is way more powerful than the breakouts seen in Daily timeframe. You can blindly invest once the weekly candle closes above the breakout line and stay invested forever. Also these stocks breakouts are lifelong predictions, it means technically these breakouts happen giving more returns in the longer runs. Hence, even when the scrip makes a loss of 10% / 20% / 30% / 50%, the stock will regain and turn around. Once they again enter the same breakout level, they will flyyyyyyyyyyyy like a ROCKET if held in the portfolio in the longer run.
Time makes money, GREEDY & EGO will not make money.
Also, magically these breakouts tend to prove that the companies turn around and fundamentally becoming strong. Also the magic happens when more diversification is done in various sectors under various scripts with equal money invested in each N500 scripts.
The real deal is when to purchase and where to purchase the stock. That is where Breakout study comes into play.
Check this stock which has made an all time low and high chances that it makes a "V" shaped recovery.
> Taking support at last years support or breakout level
> High chances that it reverses from this point.
> Volume dried up badly in last few months / days.
> Very high suspicion based analysis and not based on chart patterns / candle patterns deeply.
> VALUABLE STOCK AVAILABLE AT A DISCOUNTED PRICE
> OPPURTUNITY TO ACCUMULATE ADEQUATE QUANTITY
> MARKET AFTER A CORRECTION / PANIC FALL TO MAKE GOOD INVESTMENT
DISCLAIMER : This is just for educational purpose. This type of analysis is equivalent to catching a falling knife. If you are a warrior, you throw all the knives back else you will be sorrow if it hits SL. Make sure to do your analysis well. This type of analysis only suits high risks investor and whose is willing to throw all the knives above irrespective of any sectoral rotation. BE VERY CAUTIOUS AS IT IS EXTREME BOTTOM FISHING.
HOWEVER, THIS IS HOW MULTIBAGGERS ARE CAUGHT !
STOCK IS AT RIGHT PE / RIGHT EVALUATION / MORE ROAD TO GROW / CORRECTED IV / EXCELLENT BOOKS / USING MARKET CRASH AS AN OPPURTUNITY / EPS AT SKY.
LET'S PUMP IN SOME MONEY AND REVOLUTIONIZE THE NATION'S ECONOMY!
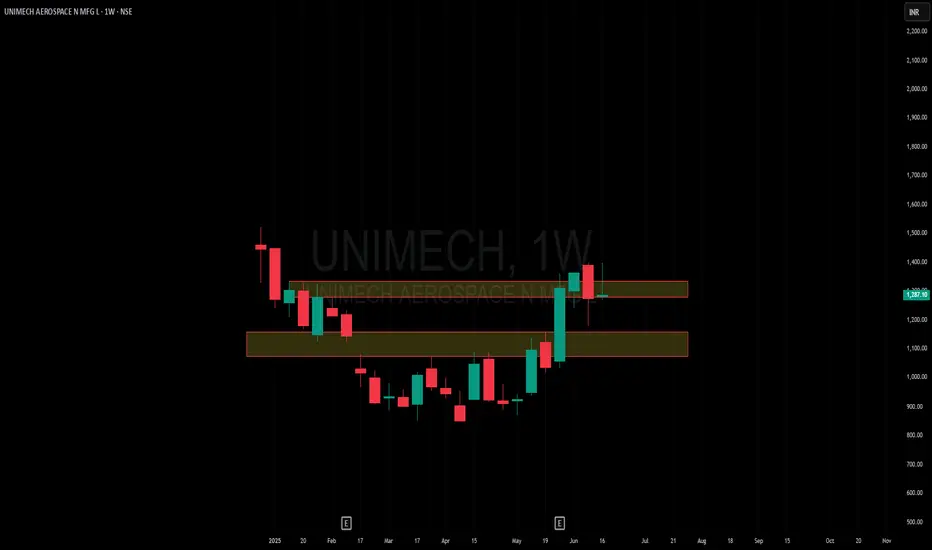
Amazing breakout on WEEKLY Timeframe - UNIMECHCheckout an amazing breakout happened in the stock in Weekly timeframe, macroscopically seen in Daily timeframe. Having a great favor that the stock might be bullish expecting a staggering returns of minimum 25% TGT. IMPORTANT BREAKOUT LEVELS ARE ALWAYS RESPECTED!
NOTE for learners: Place the breakout levels as per the chart shared and track it yourself to get amazed!!
#No complicated chart patterns
#No big big indicators
#No Excel sheet or number magics
TRADE IDEA: WAIT FOR THE STOCK TO BREAKOUT IN WEEKLY TIMEFRAME ABOVE THIS LEVEL.
Checkout an amazing breakout happened in the stock in Weekly timeframe.
Breakouts happening in longer timeframe is way more powerful than the breakouts seen in Daily timeframe. You can blindly invest once the weekly candle closes above the breakout line and stay invested forever. Also these stocks breakouts are lifelong predictions, it means technically these breakouts happen giving more returns in the longer runs. Hence, even when the scrip makes a loss of 10% / 20% / 30% / 50%, the stock will regain and turn around. Once they again enter the same breakout level, they will flyyyyyyyyyyyy like a ROCKET if held in the portfolio in the longer run.
Time makes money, GREEDY & EGO will not make money.
Also, magically these breakouts tend to prove that the companies turn around and fundamentally becoming strong. Also the magic happens when more diversification is done in various sectors under various scripts with equal money invested in each N500 scripts.
The real deal is when to purchase and where to purchase the stock. That is where Breakout study comes into play.
Check this stock which has made an all time low and high chances that it makes a "V" shaped recovery.
> Taking support at last years support or breakout level
> High chances that it reverses from this point.
> Volume dried up badly in last few months / days.
> Very high suspicion based analysis and not based on chart patterns / candle patterns deeply.
> VALUABLE STOCK AVAILABLE AT A DISCOUNTED PRICE
> OPPURTUNITY TO ACCUMULATE ADEQUATE QUANTITY
> MARKET AFTER A CORRECTION / PANIC FALL TO MAKE GOOD INVESTMENT
DISCLAIMER : This is just for educational purpose. This type of analysis is equivalent to catching a falling knife. If you are a warrior, you throw all the knives back else you will be sorrow if it hits SL. Make sure to do your analysis well. This type of analysis only suits high risks investor and whose is willing to throw all the knives above irrespective of any sectoral rotation. BE VERY CAUTIOUS AS IT IS EXTREME BOTTOM FISHING.
HOWEVER, THIS IS HOW MULTIBAGGERS ARE CAUGHT !
STOCK IS AT RIGHT PE / RIGHT EVALUATION / MORE ROAD TO GROW / CORRECTED IV / EXCELLENT BOOKS / USING MARKET CRASH AS AN OPPURTUNITY / EPS AT SKY.
LET'S PUMP IN SOME MONEY AND REVOLUTIONIZE THE NATION'S ECONOMY!
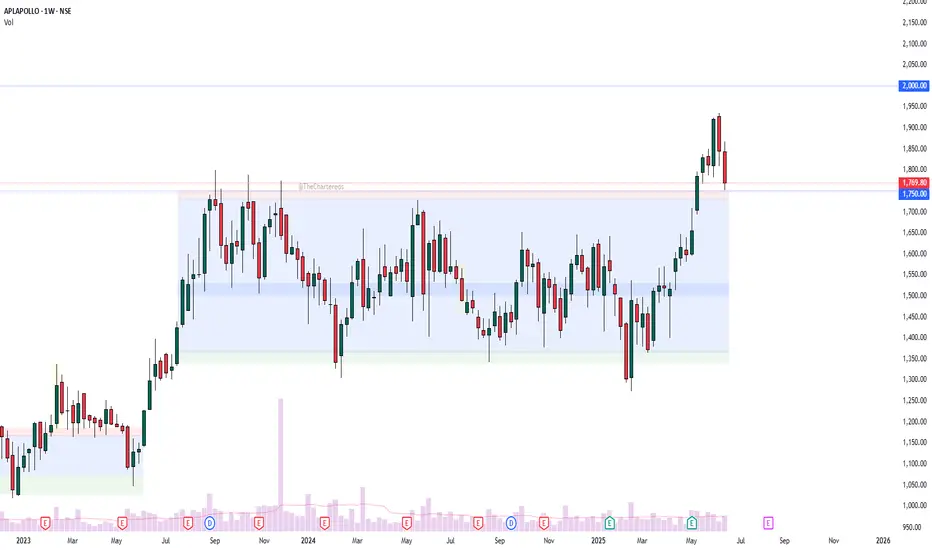
APLAPOLLO - retest phase?APL Apollo – Chart Analysis
The structure is quite clear:
Price consolidated within a tight range for nearly 2 years.
This was followed by a strong breakout accompanied by a notable volume spike.
Currently, the stock appears to be in the retest phase of the breakout zone.
Fundamental Trigger:
📢 APL Apollo Q4 Results: Net profit up 72% YoY; Board approves ₹1,500 Cr capex plan.
What’s next?
Will the retest hold and lead to the next leg up?
Let me know your thoughts 👇
Disclaimer: This analysis is for educational and informational purposes only. It is not investment advice or a recommendation to buy or sell any security. Please do your own research or consult a financial advisor before making any investment decisions. I am not a SEBI-registered advisor.
Amazing breakout on WEEKLY Timeframe - ACMESOLARCheckout an amazing breakout happened in the stock in Weekly timeframe, macroscopically seen in Daily timeframe. Having a great favor that the stock might be bullish expecting a staggering returns of minimum 25% TGT. IMPORTANT BREAKOUT LEVELS ARE ALWAYS RESPECTED!
NOTE for learners: Place the breakout levels as per the chart shared and track it yourself to get amazed!!
#No complicated chart patterns
#No big big indicators
#No Excel sheet or number magics
TRADE IDEA: WAIT FOR THE STOCK TO BREAKOUT IN WEEKLY TIMEFRAME ABOVE THIS LEVEL.
Checkout an amazing breakout happened in the stock in Weekly timeframe.
Breakouts happening in longer timeframe is way more powerful than the breakouts seen in Daily timeframe. You can blindly invest once the weekly candle closes above the breakout line and stay invested forever. Also these stocks breakouts are lifelong predictions, it means technically these breakouts happen giving more returns in the longer runs. Hence, even when the scrip makes a loss of 10% / 20% / 30% / 50%, the stock will regain and turn around. Once they again enter the same breakout level, they will flyyyyyyyyyyyy like a ROCKET if held in the portfolio in the longer run.
Time makes money, GREEDY & EGO will not make money.
Also, magically these breakouts tend to prove that the companies turn around and fundamentally becoming strong. Also the magic happens when more diversification is done in various sectors under various scripts with equal money invested in each N500 scripts.
The real deal is when to purchase and where to purchase the stock. That is where Breakout study comes into play.
Check this stock which has made an all time low and high chances that it makes a "V" shaped recovery.
> Taking support at last years support or breakout level
> High chances that it reverses from this point.
> Volume dried up badly in last few months / days.
> Very high suspicion based analysis and not based on chart patterns / candle patterns deeply.
> VALUABLE STOCK AVAILABLE AT A DISCOUNTED PRICE
> OPPURTUNITY TO ACCUMULATE ADEQUATE QUANTITY
> MARKET AFTER A CORRECTION / PANIC FALL TO MAKE GOOD INVESTMENT
DISCLAIMER : This is just for educational purpose. This type of analysis is equivalent to catching a falling knife. If you are a warrior, you throw all the knives back else you will be sorrow if it hits SL. Make sure to do your analysis well. This type of analysis only suits high risks investor and whose is willing to throw all the knives above irrespective of any sectoral rotation. BE VERY CAUTIOUS AS IT IS EXTREME BOTTOM FISHING.
HOWEVER, THIS IS HOW MULTIBAGGERS ARE CAUGHT !
STOCK IS AT RIGHT PE / RIGHT EVALUATION / MORE ROAD TO GROW / CORRECTED IV / EXCELLENT BOOKS / USING MARKET CRASH AS AN OPPURTUNITY / EPS AT SKY.
LET'S PUMP IN SOME MONEY AND REVOLUTIONIZE THE NATION'S ECONOMY!
