REL Power : Sitting right at the Red Band Resistance REL Power : Sitting right at the Red band Resistance .
It's already in a Buy trajectory and survived a Sell Signal in past few days and recovered from there.
( Not a Buy / Sell Recommendation
Do your own due diligence ,Market is subject to risks, This is my own view and for learning only .)

63 Moons : Continuing it's winning momentum after a Buy Signal63 Moons : Continuing it's winning momentum after a Buy Signal .
Last time it turned back from 864, which could be an important level to watch out for.
1070 is another major resistance if it crosses 1000 .
( Not a Buy / Sell Recommendation
Do your own due diligence ,Market is subject to risks, This is my own view and for learning only .)

JINDALSTELNSE:JINDALSTEL
Note :
1. One should go long with a Stop Loss, below the Trendline or the Previous Swing Low.
2. Risk :Reward ratio should be minimum 1:2.
3. Plan your trade as per the Money Management and Risk Appetite.
Disclaimer :
>You are responsible for your profits and loss.
>The idea shared here is purely for Educational purpose.
>Follow back, for more ideas and their notifications on your email.
>Support and Like incase the idea works for you.

Maruti
Current Price: 12257
Upside: 12806.50, 13261.75 and 13717.00
Downside: 10378.50, 9923.25 and 9468.00
Green lines represent the range. it's also the stop loss and resistance.
Stop loss: 11232.56
Resistance: 11955.48

ShreecemCurrent Price: 29710
Upside: 32277.50, 32946.88 and 33616.25
Downside: 28707.50, 28038.13 and 27368.75

Bharat Bijlee Ltd.*Bharat Bijlee Ltd.*
*W* formation on Monthly basis.
Strong Bouceback from Tripple Support Zone.
Volume Traction picking up.Today Gap (DTF) Covered with sudden Kneejerk reaction.
RSI: 1H W<M. Above 1H in Bullish zone.
EMAs: Widening Gaps amongst 50 /100 /200 levels on Monthly Basis.
_Respective Monthly Resistance levels as likely Targets._
3718 / 3937 / 4314 / 4817 / 5052 / 5382
*Trail SL with Upside*
*Book Profit as per Risk Appetite*
Improving Financials. Rising Revenue on Qtrly /Yrly basis. Consistent Profitability Margins. Growing TNW, Negligible Debt Improving To/FA Ratio. Improving WC Cycle. +ve CF from Ops. ~Consistent RoE / ROCE/ RoA
Promoter Stake Constant.
Concerns:
Decline in FII Stake.
*This is an Opinion. Do your own research as well.*
*_Happy Investing_*🤓

BLACKBUCK AT BREAKOUTBlackbuck currently trading near breakout level, its must stay above 470 to confirmed breakout, keep the stoploss at 442 in case it doesnot work.
thank you

SIYSIL Monthly Breakout Alert 📈 SIYSIL Monthly Breakout Alert 🚨 | Cup & Handle Formation
Siyaram Silk Mills Ltd ( NSE:SIYSIL ) has delivered a textbook Cup & Handle breakout on the monthly chart — a rare and powerful pattern suggesting strong long-term upside!
✅ Breakout above multi-year resistance
✅ Volume confirmation on breakout 📊
✅ Retesting the breakout zone around ₹780 – ₹800
✅ Potential for a sustained uptrend 📈
This could be the start of a major trend reversal. Watch closely for follow-up price action and increased volume.
💡 Chart timeframe: Monthly
🔍 Pattern: Cup & Handle
📆 Date: May 19, 2025
#SIYSIL #SiyaramSilk #CupAndHandle #BreakoutStocks #TechnicalAnalysis #StockMarketIndia #ManinderSinghAnalysis #Investing #NSEStocks

GODREJ PROPERTIES SWING TRADESWING TRADE SETUP
It is coming out of the accumulation zone and rectangle pattern breakout.
Buy above 2312
Target 2657
Stop Loss 1915

“USHAMART | V-Shaped Recovery with RSI Breakout | Bullish Setup”
🛠 Chart Pattern: The chart indicates a V-shaped recovery from the recent lows around ₹275 levels, forming a rounded bottom structure.
📊 Breakout Zone: Price has broken above short-term resistance near ₹315–₹320 zone on strong bullish candles.
📈 Momentum Indicator: RSI has broken above 60, currently around ~61.13, suggesting increasing bullish momentum.
🔥 Volume: Notable spike observed during breakout, confirming buying interest.
💡 Potential Setup:
• Entry on Breakout: ₹325+ (already in progress)
• Targets: ₹345 / ₹365 / ₹395
• Stoploss: Closing below ₹310 or below breakout candle low
🧠 Positional/Swing Trade Setup: Traders can consider entry on dips near ₹315–₹320 or on sustained move above ₹330 with volume confirmation.
⸻
⚠️ Disclaimer:
This chart analysis is provided strictly for educational and informational purposes only.
It does not constitute investment advice or a solicitation to buy/sell any securities.
Always consult a SEBI-registered financial advisor before making trading decisions.
Finsight Research | #TradeWithKnowledge

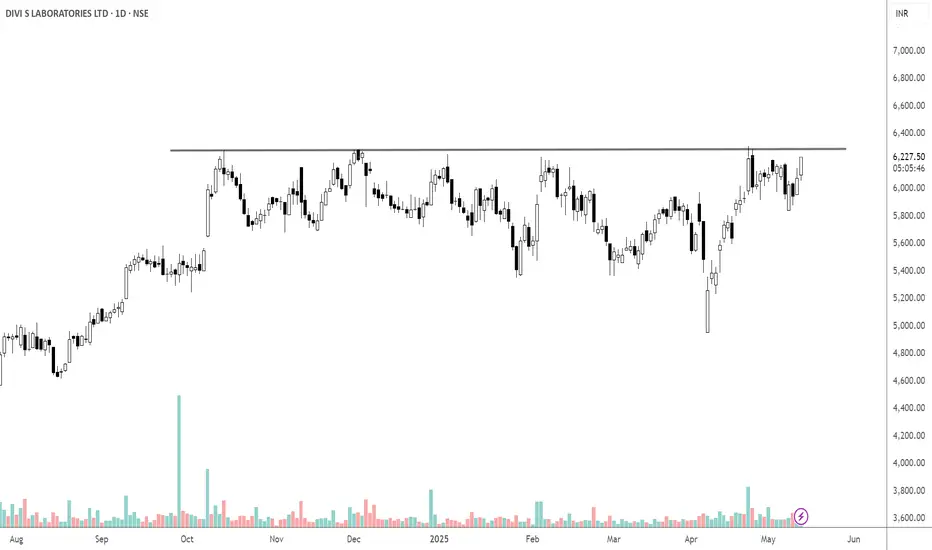
#DIVISLAB - 1000 POINTS MOVE EXPECTEDCurrent Price: 5942
Upside: 6456.34 6697.75 6954.63 7211.50
Downside: 5570.02 5327.75 5070.88 4814.00
Checkout all the levels marked in the chart
Pls comment whatever you observe.

TCS EASY CHARTI think this is one of the most easy chart of a stock io know what is and will happen in the stock. I will be posting details of smaller levels on this stock.

Som Distilleries, SDBL.Stock has been in consolidation for almost 2 years. It has also tested the resistance for 3 times, if stock closes above 150 we can see another 40-50% rally given favorable overall market conditions.

DHANI SERVICES MAY GIVE BREAKOUT SOONDhani Services is an Indian consumer business that operates through its app, Dhani. It provides a range of services, including digital healthcare, financial services, e-commerce, UPI payments, stock trading, and bill payments. The company was originally founded as Indiabulls Ventures Limited in 1995 but was later renamed Dhani Services Limited in October 2020.
SHORT TERM MAY TOUCH 69 TO 72 MARK.

Cup and Handle Breakout | Strong Trend Reversal in PlayNSE:PREMEXPLN
Analysis:
This chart showcases a classic "Cup and Handle" breakout pattern — a powerful bullish reversal setup. After a prolonged downtrend, the stock formed a rounded base, retested the neckline zone near ₹500, and broke out with strong momentum and volume.
Trendline Breakout: A long-term descending trendline has been broken, signaling a trend reversal.
Cup Formation: A smooth, rounded bottom formed over several months indicates accumulation and base-building.
Breakout Confirmation: A sharp breakout above the neckline resistance (around ₹500–₹510) with volume confirms the breakout.
Target Levels: Price has already moved toward ₹606 and is now approaching ₹678 — the measured move target from the depth of the cup.
Trade Setup:
Entry: Ideal entry was near breakout of ₹510.
Targets: ₹606 (hit), ₹678 (approaching).
Stop-loss: Below ₹500 or trailing below recent swing lows for momentum trades.
Outlook:
The chart signals a strong reversal and momentum continuation. If ₹678 is broken, further upside potential opens up.
HAPPY TRADING !!

“PRAJIND | Double Bottom Formation & RSI Reversal | Breakout Pattern Formed: A potential Double Bottom is forming around ₹445 zone – a classic reversal pattern indicating exhaustion of selling pressure.
🔍 Support Zone: ₹443–₹445 has been respected twice — making it a significant demand zone.
📊 Volume: Slight rise in recent candles with green strength, supporting buyers’ return.
📈 RSI Analysis: RSI has crossed above 50 (currently at ~57) — indicating building momentum from oversold region.
🎯 Levels to Watch:
• Immediate Resistance: ₹520
• Breakout Confirmation Above: ₹520–₹530
• Targets Post-Breakout: ₹580 / ₹620
• Invalidation/SL Zone: Below ₹440 on closing basis
💡 Strategy:
🔹 Breakout traders can watch ₹520+ levels with volume confirmation.
🔹 Swing traders may consider entries on retest or pullback post breakout.
⸻
⚠️ Professional Disclaimer:
This analysis is shared purely for educational purposes and is not a buy/sell recommendation.
Please consult your SEBI-registered financial advisor before making any investment decision.
📌 SEBI Research Analyst Registration – In Progress
Finsight Research | #LearnBeforeYouEarn

TATATECHKeep eye on TATATECH. If the price moves above 732, consider buying with a small SL.
Confirmation of the head and shoulders pattern occurs when the price breaks decisively below the neckline
Disclaimer:
This is not financial advice. Please do your own research or consult with a financial advisor before making any investment decisions. Investments in stocks can be risky and may result in loss of capital.

Edge of Breakout As we can see in the chart PTC making cup and handle pattern Also company is fundamentally good
Buy after closing 190
First Target should be 200
Second Target 240
-----------------------------------------
Disclaimer- Do your own analysis.


HDFC BANK S/R for 19/5/25Support and Resistance Levels:
Support Levels: These are price points (green line/shade) where a downward trend may be halted due to a concentration of buying interest. Imagine them as a safety net where buyers step in, preventing further decline.
Resistance Levels: Conversely, resistance levels (red line/shade) are where upward trends might stall due to increased selling interest. They act like a ceiling where sellers come in to push prices down.
Breakouts:
Bullish Breakout: When the price moves above resistance, it often indicates strong buying interest and the potential for a continued uptrend. Traders may view this as a signal to buy or hold.
Bearish Breakout: When the price falls below support, it can signal strong selling interest and the potential for a continued downtrend. Traders might see this as a cue to sell or avoid buying.
MA Ribbon (EMA 20, EMA 50, EMA 100, EMA 200) :
Above EMA: If the stock price is above the EMA, it suggests a potential uptrend or bullish momentum.
Below EMA: If the stock price is below the EMA, it indicates a potential downtrend or bearish momentum.
Trendline: A trendline is a straight line drawn on a chart to represent the general direction of a data point set.
Uptrend Line: Drawn by connecting the lows in an upward trend. Indicates that the price is moving higher over time. Acts as a support level, where prices tend to bounce upward.
Downtrend Line: Drawn by connecting the highs in a downward trend. Indicates that the price is moving lower over time. It acts as a resistance level, where prices tend to drop.
Disclaimer:
I am not a SEBI registered. The information provided here is for learning purposes only and should not be interpreted as financial advice. Consider the broader market context and consult with a qualified financial advisor before making investment decisions.

I D E A IDEA
what a disaster this company is proving to be and Govt is also becoming a sucker.
Why should Pvt losses be put on Govt coffers
high time this is closed down.
