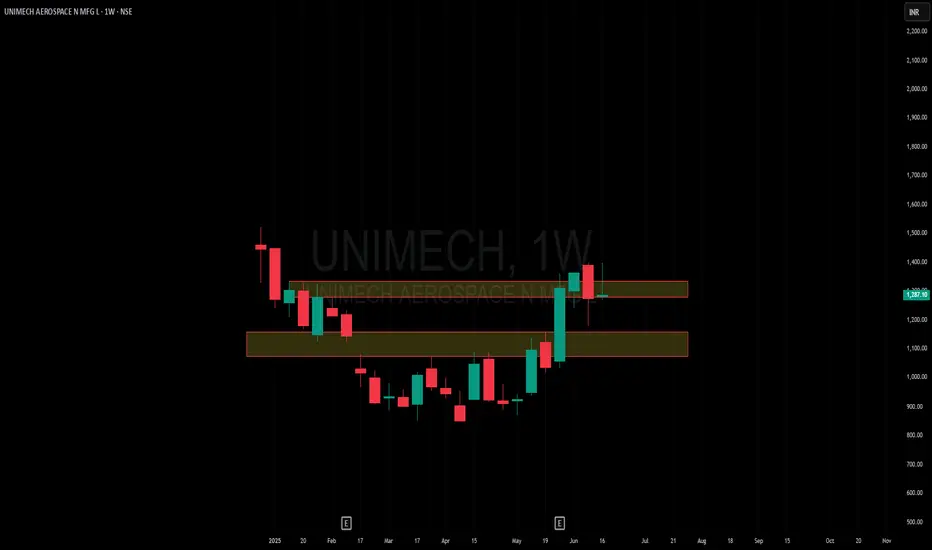
Amazing breakout on WEEKLY Timeframe - UNIMECHCheckout an amazing breakout happened in the stock in Weekly timeframe, macroscopically seen in Daily timeframe. Having a great favor that the stock might be bullish expecting a staggering returns of minimum 25% TGT. IMPORTANT BREAKOUT LEVELS ARE ALWAYS RESPECTED!
NOTE for learners: Place the breakout levels as per the chart shared and track it yourself to get amazed!!
#No complicated chart patterns
#No big big indicators
#No Excel sheet or number magics
TRADE IDEA: WAIT FOR THE STOCK TO BREAKOUT IN WEEKLY TIMEFRAME ABOVE THIS LEVEL.
Checkout an amazing breakout happened in the stock in Weekly timeframe.
Breakouts happening in longer timeframe is way more powerful than the breakouts seen in Daily timeframe. You can blindly invest once the weekly candle closes above the breakout line and stay invested forever. Also these stocks breakouts are lifelong predictions, it means technically these breakouts happen giving more returns in the longer runs. Hence, even when the scrip makes a loss of 10% / 20% / 30% / 50%, the stock will regain and turn around. Once they again enter the same breakout level, they will flyyyyyyyyyyyy like a ROCKET if held in the portfolio in the longer run.
Time makes money, GREEDY & EGO will not make money.
Also, magically these breakouts tend to prove that the companies turn around and fundamentally becoming strong. Also the magic happens when more diversification is done in various sectors under various scripts with equal money invested in each N500 scripts.
The real deal is when to purchase and where to purchase the stock. That is where Breakout study comes into play.
Check this stock which has made an all time low and high chances that it makes a "V" shaped recovery.
> Taking support at last years support or breakout level
> High chances that it reverses from this point.
> Volume dried up badly in last few months / days.
> Very high suspicion based analysis and not based on chart patterns / candle patterns deeply.
> VALUABLE STOCK AVAILABLE AT A DISCOUNTED PRICE
> OPPURTUNITY TO ACCUMULATE ADEQUATE QUANTITY
> MARKET AFTER A CORRECTION / PANIC FALL TO MAKE GOOD INVESTMENT
DISCLAIMER : This is just for educational purpose. This type of analysis is equivalent to catching a falling knife. If you are a warrior, you throw all the knives back else you will be sorrow if it hits SL. Make sure to do your analysis well. This type of analysis only suits high risks investor and whose is willing to throw all the knives above irrespective of any sectoral rotation. BE VERY CAUTIOUS AS IT IS EXTREME BOTTOM FISHING.
HOWEVER, THIS IS HOW MULTIBAGGERS ARE CAUGHT !
STOCK IS AT RIGHT PE / RIGHT EVALUATION / MORE ROAD TO GROW / CORRECTED IV / EXCELLENT BOOKS / USING MARKET CRASH AS AN OPPURTUNITY / EPS AT SKY.
LET'S PUMP IN SOME MONEY AND REVOLUTIONIZE THE NATION'S ECONOMY!
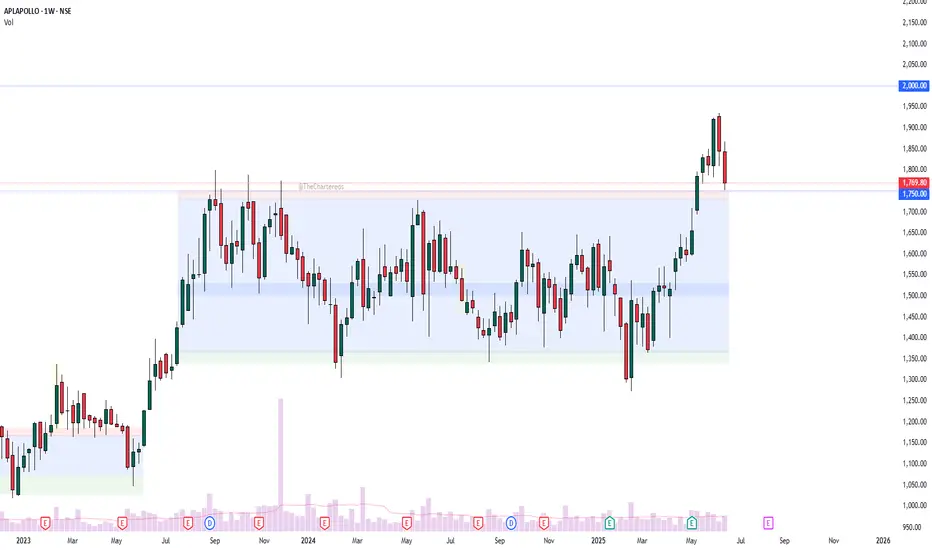
APLAPOLLO - retest phase?APL Apollo – Chart Analysis
The structure is quite clear:
Price consolidated within a tight range for nearly 2 years.
This was followed by a strong breakout accompanied by a notable volume spike.
Currently, the stock appears to be in the retest phase of the breakout zone.
Fundamental Trigger:
📢 APL Apollo Q4 Results: Net profit up 72% YoY; Board approves ₹1,500 Cr capex plan.
What’s next?
Will the retest hold and lead to the next leg up?
Let me know your thoughts 👇
Disclaimer: This analysis is for educational and informational purposes only. It is not investment advice or a recommendation to buy or sell any security. Please do your own research or consult a financial advisor before making any investment decisions. I am not a SEBI-registered advisor.
Amazing breakout on WEEKLY Timeframe - ACMESOLARCheckout an amazing breakout happened in the stock in Weekly timeframe, macroscopically seen in Daily timeframe. Having a great favor that the stock might be bullish expecting a staggering returns of minimum 25% TGT. IMPORTANT BREAKOUT LEVELS ARE ALWAYS RESPECTED!
NOTE for learners: Place the breakout levels as per the chart shared and track it yourself to get amazed!!
#No complicated chart patterns
#No big big indicators
#No Excel sheet or number magics
TRADE IDEA: WAIT FOR THE STOCK TO BREAKOUT IN WEEKLY TIMEFRAME ABOVE THIS LEVEL.
Checkout an amazing breakout happened in the stock in Weekly timeframe.
Breakouts happening in longer timeframe is way more powerful than the breakouts seen in Daily timeframe. You can blindly invest once the weekly candle closes above the breakout line and stay invested forever. Also these stocks breakouts are lifelong predictions, it means technically these breakouts happen giving more returns in the longer runs. Hence, even when the scrip makes a loss of 10% / 20% / 30% / 50%, the stock will regain and turn around. Once they again enter the same breakout level, they will flyyyyyyyyyyyy like a ROCKET if held in the portfolio in the longer run.
Time makes money, GREEDY & EGO will not make money.
Also, magically these breakouts tend to prove that the companies turn around and fundamentally becoming strong. Also the magic happens when more diversification is done in various sectors under various scripts with equal money invested in each N500 scripts.
The real deal is when to purchase and where to purchase the stock. That is where Breakout study comes into play.
Check this stock which has made an all time low and high chances that it makes a "V" shaped recovery.
> Taking support at last years support or breakout level
> High chances that it reverses from this point.
> Volume dried up badly in last few months / days.
> Very high suspicion based analysis and not based on chart patterns / candle patterns deeply.
> VALUABLE STOCK AVAILABLE AT A DISCOUNTED PRICE
> OPPURTUNITY TO ACCUMULATE ADEQUATE QUANTITY
> MARKET AFTER A CORRECTION / PANIC FALL TO MAKE GOOD INVESTMENT
DISCLAIMER : This is just for educational purpose. This type of analysis is equivalent to catching a falling knife. If you are a warrior, you throw all the knives back else you will be sorrow if it hits SL. Make sure to do your analysis well. This type of analysis only suits high risks investor and whose is willing to throw all the knives above irrespective of any sectoral rotation. BE VERY CAUTIOUS AS IT IS EXTREME BOTTOM FISHING.
HOWEVER, THIS IS HOW MULTIBAGGERS ARE CAUGHT !
STOCK IS AT RIGHT PE / RIGHT EVALUATION / MORE ROAD TO GROW / CORRECTED IV / EXCELLENT BOOKS / USING MARKET CRASH AS AN OPPURTUNITY / EPS AT SKY.
LET'S PUMP IN SOME MONEY AND REVOLUTIONIZE THE NATION'S ECONOMY!

Amazing breakout on WEEKLY Timeframe - WOCKPHARMACheckout an amazing breakout happened in the stock in Weekly timeframe, macroscopically seen in Daily timeframe. Having a great favor that the stock might be bullish expecting a staggering returns of minimum 25% TGT. IMPORTANT BREAKOUT LEVELS ARE ALWAYS RESPECTED!
NOTE for learners: Place the breakout levels as per the chart shared and track it yourself to get amazed!!
#No complicated chart patterns
#No big big indicators
#No Excel sheet or number magics
TRADE IDEA: WAIT FOR THE STOCK TO BREAKOUT IN WEEKLY TIMEFRAME ABOVE THIS LEVEL.
Checkout an amazing breakout happened in the stock in Weekly timeframe.
Breakouts happening in longer timeframe is way more powerful than the breakouts seen in Daily timeframe. You can blindly invest once the weekly candle closes above the breakout line and stay invested forever. Also these stocks breakouts are lifelong predictions, it means technically these breakouts happen giving more returns in the longer runs. Hence, even when the scrip makes a loss of 10% / 20% / 30% / 50%, the stock will regain and turn around. Once they again enter the same breakout level, they will flyyyyyyyyyyyy like a ROCKET if held in the portfolio in the longer run.
Time makes money, GREEDY & EGO will not make money.
Also, magically these breakouts tend to prove that the companies turn around and fundamentally becoming strong. Also the magic happens when more diversification is done in various sectors under various scripts with equal money invested in each N500 scripts.
The real deal is when to purchase and where to purchase the stock. That is where Breakout study comes into play.
Check this stock which has made an all time low and high chances that it makes a "V" shaped recovery.
> Taking support at last years support or breakout level
> High chances that it reverses from this point.
> Volume dried up badly in last few months / days.
> Very high suspicion based analysis and not based on chart patterns / candle patterns deeply.
> VALUABLE STOCK AVAILABLE AT A DISCOUNTED PRICE
> OPPURTUNITY TO ACCUMULATE ADEQUATE QUANTITY
> MARKET AFTER A CORRECTION / PANIC FALL TO MAKE GOOD INVESTMENT
DISCLAIMER : This is just for educational purpose. This type of analysis is equivalent to catching a falling knife. If you are a warrior, you throw all the knives back else you will be sorrow if it hits SL. Make sure to do your analysis well. This type of analysis only suits high risks investor and whose is willing to throw all the knives above irrespective of any sectoral rotation. BE VERY CAUTIOUS AS IT IS EXTREME BOTTOM FISHING.
HOWEVER, THIS IS HOW MULTIBAGGERS ARE CAUGHT !
STOCK IS AT RIGHT PE / RIGHT EVALUATION / MORE ROAD TO GROW / CORRECTED IV / EXCELLENT BOOKS / USING MARKET CRASH AS AN OPPURTUNITY / EPS AT SKY.
LET'S PUMP IN SOME MONEY AND REVOLUTIONIZE THE NATION'S ECONOMY!

Amazing breakout on WEEKLY Timeframe - KARURVYSYACheckout an amazing breakout happened in the stock in Weekly timeframe, macroscopically seen in Daily timeframe. Having a great favor that the stock might be bullish expecting a staggering returns of minimum 25% TGT. IMPORTANT BREAKOUT LEVELS ARE ALWAYS RESPECTED!
NOTE for learners: Place the breakout levels as per the chart shared and track it yourself to get amazed!!
#No complicated chart patterns
#No big big indicators
#No Excel sheet or number magics
TRADE IDEA: WAIT FOR THE STOCK TO BREAKOUT IN WEEKLY TIMEFRAME ABOVE THIS LEVEL.
Checkout an amazing breakout happened in the stock in Weekly timeframe.
Breakouts happening in longer timeframe is way more powerful than the breakouts seen in Daily timeframe. You can blindly invest once the weekly candle closes above the breakout line and stay invested forever. Also these stocks breakouts are lifelong predictions, it means technically these breakouts happen giving more returns in the longer runs. Hence, even when the scrip makes a loss of 10% / 20% / 30% / 50%, the stock will regain and turn around. Once they again enter the same breakout level, they will flyyyyyyyyyyyy like a ROCKET if held in the portfolio in the longer run.
Time makes money, GREEDY & EGO will not make money.
Also, magically these breakouts tend to prove that the companies turn around and fundamentally becoming strong. Also the magic happens when more diversification is done in various sectors under various scripts with equal money invested in each N500 scripts.
The real deal is when to purchase and where to purchase the stock. That is where Breakout study comes into play.
Check this stock which has made an all time low and high chances that it makes a "V" shaped recovery.
> Taking support at last years support or breakout level
> High chances that it reverses from this point.
> Volume dried up badly in last few months / days.
> Very high suspicion based analysis and not based on chart patterns / candle patterns deeply.
> VALUABLE STOCK AVAILABLE AT A DISCOUNTED PRICE
> OPPURTUNITY TO ACCUMULATE ADEQUATE QUANTITY
> MARKET AFTER A CORRECTION / PANIC FALL TO MAKE GOOD INVESTMENT
DISCLAIMER : This is just for educational purpose. This type of analysis is equivalent to catching a falling knife. If you are a warrior, you throw all the knives back else you will be sorrow if it hits SL. Make sure to do your analysis well. This type of analysis only suits high risks investor and whose is willing to throw all the knives above irrespective of any sectoral rotation. BE VERY CAUTIOUS AS IT IS EXTREME BOTTOM FISHING.
HOWEVER, THIS IS HOW MULTIBAGGERS ARE CAUGHT !
STOCK IS AT RIGHT PE / RIGHT EVALUATION / MORE ROAD TO GROW / CORRECTED IV / EXCELLENT BOOKS / USING MARKET CRASH AS AN OPPURTUNITY / EPS AT SKY.
LET'S PUMP IN SOME MONEY AND REVOLUTIONIZE THE NATION'S ECONOMY!

Swing the TORNTPOWER (NSE)🔍 **Technical Analysis Summary:**
✅ **Trendline Support:**
* The weekly chart shows a **well-respected ascending trendline** stretching from early 2023.
* The current price action at ₹1,390 is approaching this **long-term support zone**, which has consistently provided **bullish rebounds** in the past.
* Price action continues to form **higher lows**, confirming a structurally bullish pattern.
📊 **MACD on OBV (Volume Strength Indicator):**
* The **MACD applied on On-Balance Volume (OBV)** is showing early signs of **bullish divergence**.
* This is particularly important as OBV integrates volume with price movement, and **MACD crossover at low levels** typically indicates accumulation and **potential trend reversal**.
* A bounce in OBV would further confirm strength backed by **smart volume participation**.
⚠️ **Caution Point:**
* The recent candles have shown some **indecision and consolidation**, indicating market participants are awaiting a catalyst.
* **Global cues or negative macroeconomic factors** could temporarily break the trend, but unless a strong bearish breakdown with volume occurs, this trendline remains **technically intact and valid**.
---
💡 **Investment Thesis:**
TORNTPOWER is currently trading near a **strong, multi-touch ascending trendline** that has provided reliable support for over 18 months. The **MACD on OBV** is hinting at a **volume-backed trend reversal**, suggesting a **bullish bounce is likely** if macro sentiment remains neutral or positive.
🎯 **Trading Strategy:**
* **Entry Zone:** ₹1,370–₹1,400 (near the trendline support)
* **Stop Loss:** Below ₹1,300 (on weekly closing basis)
* **Upside Targets:**
* ₹1,550 (short-term resistance)
* ₹1,750+ (medium-term target if the trend continues)
🧠 Final Word:
This setup offers an attractive **risk-reward ratio** for swing traders and positional investors. Technicals favor a bounce — **stay cautious on macro cues**, but the **structure favors accumulation on dips** near the trendline.

Birlasoft Ltd (BSOFT) – Long-Term Technical Analysis (TF-1D)📊 Chart Pattern Observed:
• The stock is forming a symmetrical triangle pattern, a consolidation pattern often leading to a breakout.
• Points A-B-C form higher lows, showing long-term support.
• The upper resistance lies near ₹739.90, indicating a potential breakout target.
⸻
📉 Current Price:
• ₹421.40, which is just above the highlighted “Best Buying Range” zone.
⸻
🟨 Best Buying Zone:
• Marked between ₹387.25 and ₹351.25.
• This zone is close to the lower trendline support (rising support), making it an ideal accumulation level.
⸻
📈 Upside Potential:
• If the stock sustains above the trendline and continues the triangle structure, it may head toward the ₹739.90 level.
• A breakout above ₹739.90 could trigger a strong upward move.
⸻
🔍 Momentum & RSI:
• The RSI is at 43.28, which is near the lower end — suggesting the stock is neither overbought nor oversold.
• Good for long-term entry if bullish confirmation appears.
⸻
📌 Key Support Levels:
• ₹387.25 (first support)
• ₹351.25 (strong support)
🚀 Key Resistance:
• ₹739.90 (major breakout level)
⸻
📝 Conclusion:
Birlasoft is currently in a long-term consolidation phase within a symmetrical triangle. The current price is above a strong support zone, making it a good risk-reward entry for long-term investors, especially between ₹387–₹351. A breakout above ₹740 could signal a major bullish rally.
⚠️ Disclaimer:
This analysis is for educational purposes only. I am not a SEBI registered advisor. Please consult your financial advisor before making any investment decisions.

Hdfc life gives breakout of 4 year consolidation zoneHdfc life gave weekly breakout of 4 year consolidation zone.

INDUS TOWER- BREAKOUTNSE:INDUSTOWER Monthly breakout almost 9 years consolidation breakout and retest on monthly chart. price will continue further rally from here.

NRB BEARING - LONGNSE:NRBBEARING Weekly channel breakout with outperforming the market. Bullish setup will continue in near future.

DMART - LONGNSE:DMART Weekly rounding bottom formation , price giving breakout with retest and again breakout may continue trend upward till previous top.

BHEL- LONGNSE:BHEL Weekly continuous formation with strict tight channel may continue further bullish rally in near term.

Indus on the MoveIndus Towers Ltd is India’s largest telecom tower infrastructure company, operating over 220,000 towers and enabling more than 340,000 colocations across all 22 telecom circles. Backed by Bharti Airtel (holding ~50%), the company offers long-term revenue visibility, steady cash flows, and a crucial position in India’s telecom value chain—especially as the country rapidly expands its 5G infrastructure.
In Q4 FY25, the company reported a standalone revenue of ₹7,727 crore, up 7.4% year-on-year. Consolidated revenue also rose to ₹7,547 crore. Net profit margins remain robust at around 33%, while the return on equity (ROE) stands strong at 30–33%. Operating efficiency is also reflected in the return on capital employed (ROCE), which is approximately 28.6%.
Liquidity remains healthy, with ₹33.4 billion in cash and short-term investments, positive working capital of ₹31.4 billion, and operating cash flow of ₹11,582 crore in FY2024. The company has a manageable debt-to-equity ratio of ~0.65 and net debt around ₹178 billion. Valuation metrics are attractive: a price-to-earnings (P/E) ratio near 10.8x and EV/EBITDA of ~5.6x suggest the stock is undervalued relative to its cash-generating strength. The Piotroski F-score of 7–8 reflects solid financial health.
Overall, the fundamentals indicate that Indus Towers is a stable, cash-rich business with long-term growth potential linked to telecom and data consumption growth in India.
📉 Technical Outlook
The 2-hour chart reflects a significant breakout pattern. A long-standing descending trendline has acted as dynamic resistance since April, repeatedly pushing the price lower. However, recent price action shows a strong breakout above this trendline, accompanied by bullish candles and higher volume.
The reversal zone between ₹388–392 acted as a key support area where buyers stepped in. The breakout above this zone followed by a push beyond the ₹404–408 zone signals strong upside momentum.
Key levels to monitor:
Close Above ₹408: Confirms the breakout and initiates bullish momentum.
Resistance Targets: ₹424 (R1), ₹438 (R2), and ₹462 (R3).
Support Zone: ₹388–392 remains a demand area. A move below this may invalidate the setup.
The pattern suggests a shift from lower highs to potential higher highs, which can attract swing and positional traders.
✅ Conclusion
Indus Towers is a classic case where fundamentals and technicals align. On one hand, it boasts strong earnings, consistent cash flow, low valuation, and strategic importance in India’s 5G rollout. On the other, the recent breakout from a long-term resistance trendline shows a potential trend reversal on the chart.
For investors and traders, this confluence presents a compelling opportunity. An entry in the ₹404–408 range could yield solid returns, with targets at ₹424, ₹438, and ₹462. A stop-loss below ₹388 is advisable to manage risk.
Disclaimer: lnkd.in

WAAREE ENERGIES LTD On WeeklyWAAREE ENERGIES LTD Buy Signal by Our Indicator on weekly time frame, W.ADR% is bit higher so trade with small amount.

RELIANCE INDUSTRIES LTD On WeeklyRELIANCE INDUSTRIES LTD at 1466 seems good for position trading. near upper side 1590.
if close above 1600 than hold for more weeks. For stoploss set according to W.ADR %.
Analysis based on my private indicator.

CSBBANK at Best Support !!This is the Daily Chart of CSBBANK.
CSBBANK is currently showing momentum while taking support from the EMA and SMA at 380 and 368 range.
If this level is sustain , then We may see higher prices in CSBBANK
Thank You !!

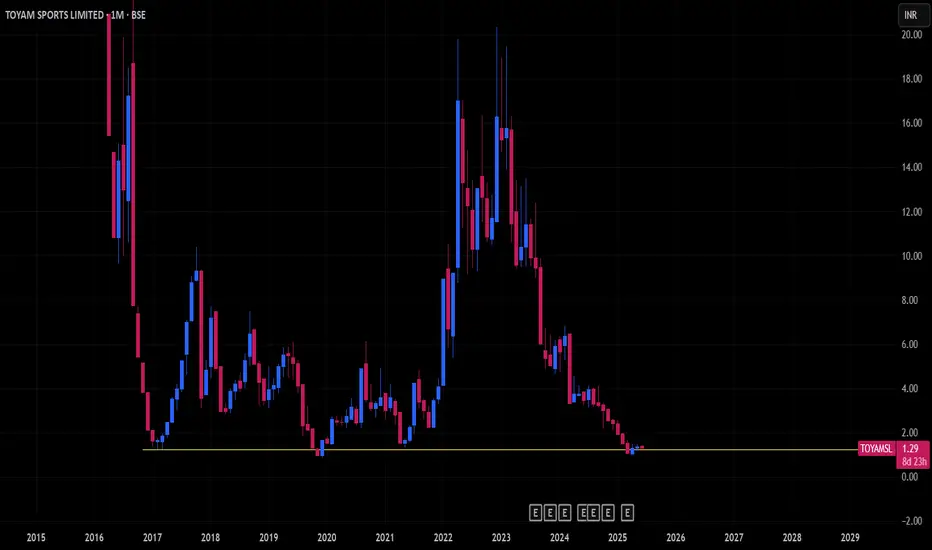
Huge supportprice is at multiyear low
this support is very strong because it is holding price from past many years
it is very risky bet, risk of capital loss is huge
i have taken small position
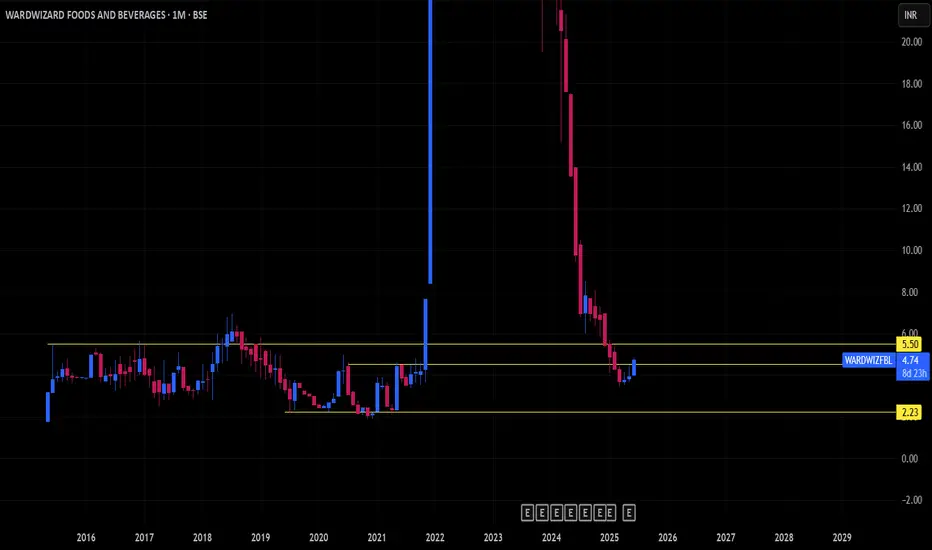
Big supportprice is at very big support area, in the past it has given huge rally from same price area
it is very risky, but i have taken a decent position in this
risk of capital loss is huge in this stock, but if this performs then i think reward will be very huge
Bajaj finance for Swing Bajaj finance is good looking for swing,
Small sl, and good support,
Add in your watchlist.

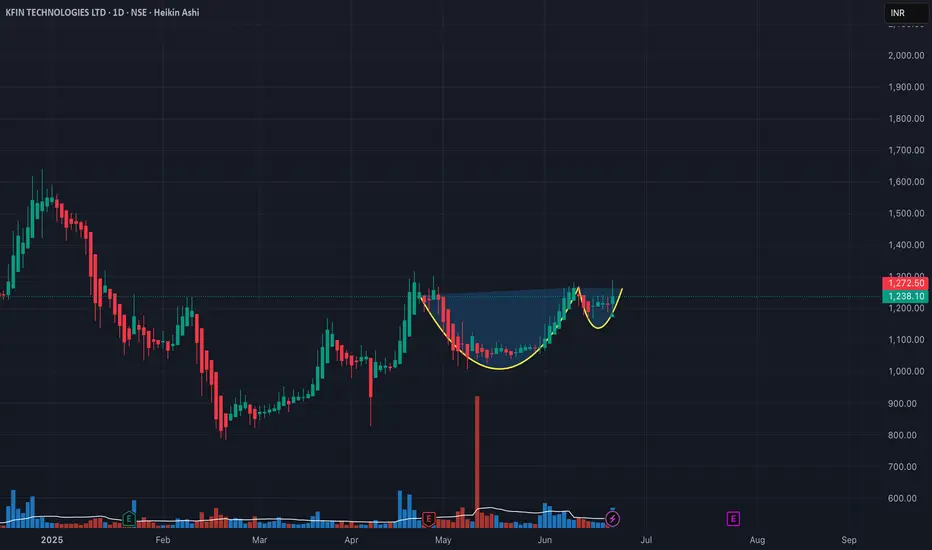
HOMEFIRST Proper Cup and Handle in place. Finance and Banking Stocks are all the buzz right now, this should be on your radar for a long trade.

MAITHANALL - A bullish flag structureMetals are going to soar once the volatility subsides. Structures are already visible in some names. These are going to be the leaders of tomorrow.

SWIGGY - Higher HighsSwiggy has been the talk of the street this week and rightfully so. The chart shows a lot of positives here. Coming out of a base, good volumes coupled with a rising RS. The ingredients for a sustained trend are all there. Sub 400 prices should be a good spot to buy and accumulate.
