KfintechKfinTech, a super start stock, forming triangle patter and flying to unchartered zone. target are expected to 1200, 1300...

DELHIVERY LTD S/RSupport and Resistance Levels:
Support Levels: These are price points (green line/shade) where a downward trend may be halted due to a concentration of buying interest. Imagine them as a safety net where buyers step in, preventing further decline.
Resistance Levels: Conversely, resistance levels (red line/shade) are where upward trends might stall due to increased selling interest. They act like a ceiling where sellers come in to push prices down.
Breakouts:
Bullish Breakout: When the price moves above resistance, it often indicates strong buying interest and the potential for a continued uptrend. Traders may view this as a signal to buy or hold.
Bearish Breakout: When the price falls below support, it can signal strong selling interest and the potential for a continued downtrend. Traders might see this as a cue to sell or avoid buying.
MA Ribbon (EMA 20, EMA 50, EMA 100, EMA 200) :
Above EMA: If the stock price is above the EMA, it suggests a potential uptrend or bullish momentum.
Below EMA: If the stock price is below the EMA, it indicates a potential downtrend or bearish momentum.
Trendline: A trendline is a straight line drawn on a chart to represent the general direction of a data point set.
Uptrend Line: Drawn by connecting the lows in an upward trend. Indicates that the price is moving higher over time. Acts as a support level, where prices tend to bounce upward.
Downtrend Line: Drawn by connecting the highs in a downward trend. Indicates that the price is moving lower over time. It acts as a resistance level, where prices tend to drop.
Disclaimer:
I am not a SEBI registered. The information provided here is for learning purposes only and should not be interpreted as financial advice. Consider the broader market context and consult with a qualified financial advisor before making investment decisions.

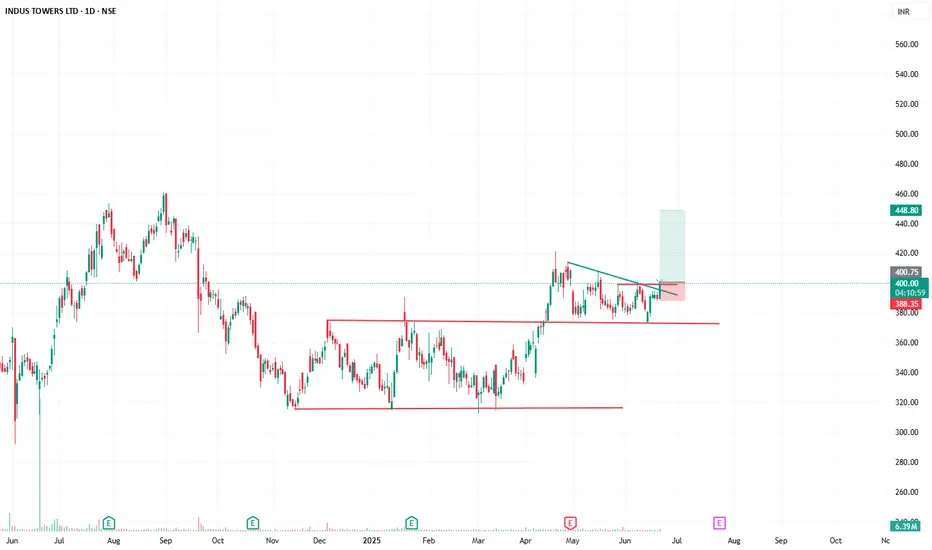
INDUSTOWER BULLISH PATTERN📡 "Tower Break! Signal Caught at ₹400"
🚀 Chart Pattern: Falling Trendline Breakout + Range Break
📈 Current Price: ₹400.25
🎯 Target: ₹448.80
🛡️ Stoploss: ₹388.15
📊 Risk:Reward ≈ 1:3.75
🔍 Volume Spike confirms breakout
🔻 Accumulation between ₹360–₹395 now acting as base
💡 Trade Setup:
After a long consolidation in a rectangular range, the price has broken out of both horizontal and descending resistance lines with strong volume. The price is above the breakout zone and retesting the level.
KFINTECHKFINTECH
Watch this stock very carefully at current price 1243, Ready for Target 1300, 1350 in few weeks..

Riding the Final Wave: Eicher Motors Aiming for the MOON.🔍 Wave Structure Analysis (Elliott Wave Count):
The chart follows a classic 5-wave impulsive structure:
Wave i → ii → iii → iv → v (subwaves of primary wave 1).
Wave (ii) retraced ~38.2% of Wave (i), showing healthy correction.
Wave (iii) extended well, with internal sub-waves clearly marked (i, ii, iii, iv, v).
Current move is likely Wave v of 1, still in progress.
📐 Fibonacci Levels (Retracement & Projection):
Wave (ii) retraced to 0.382 (₹2,101.80) — ideal for wave ii corrections.
Wave (iii) reached 1.618 extension of Wave (i) at around ₹5,048.85 — confirming it as an extended wave.
Wave (iv) respected the 0.382 retracement zone from Wave (iii), retraced till around ₹4,208.70 – ₹4,538.55.
Projected Target for Wave (v): ~₹7,635.55 (also marked as end of Wave 1 in pink).
📊 Indicators:
RSI: Currently at 57.09, just above the neutral zone.
Indicates moderate bullish momentum, not overbought.
RSI is rising, supporting the continuation of wave v.
Volume: Fairly steady — no divergence observed, backing the price action strength.
✅ Key Support Zones:
₹4,208 – ₹4,538: Support cluster (Fibo retracement zone of wave iv).
₹2,766.05 and ₹2,101.80: Long-term supports from earlier wave structures and retracement levels.
⚠️ Verification & Corrections:
✅ Wave labeling and Fibonacci levels appear technically correct.
✅ Subwaves are well-defined and follow Elliott Wave rules:
Wave iii is not the shortest.
Wave iv does not enter Wave i territory.
⚠️ Keep an eye on divergence or failure at ₹5,900–₹6,000 zone — critical resistance before ₹7,600.
📌 Summary:
Eicher Motors is in the final stages of completing Wave v of Primary Wave 1, with a projected upside target near ₹7,635. RSI and volume confirm a healthy uptrend, and Fibo levels add credibility. The structure appears valid and aligns well with classical Elliott Wave and Fibonacci guidelines.

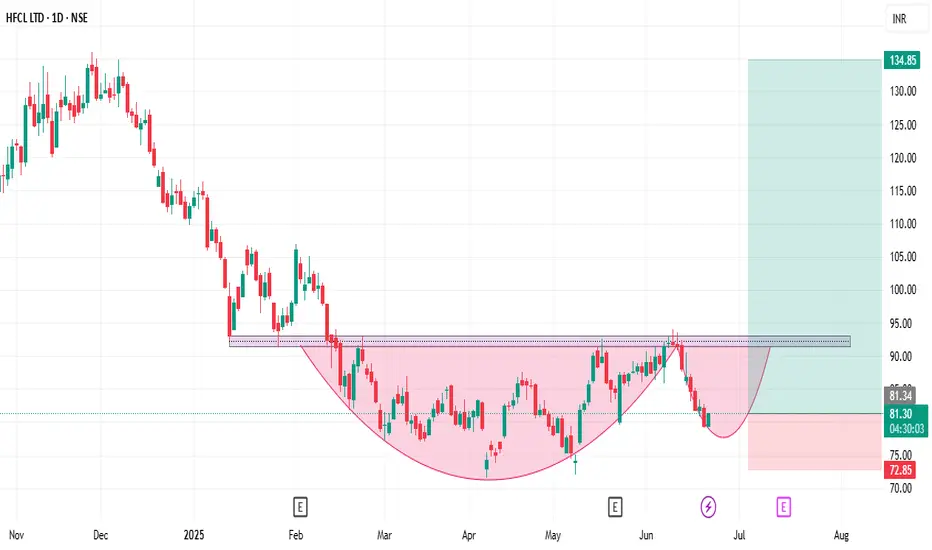
HFCL Super Long Trade Setup📊 Price Action & Trend Analysis
Analyzing market trends using price action, key support/resistance levels, and candlestick patterns to identify high-probability trade setups.
Always follow the trend and manage risk wisely!
Price Action Analysis Interprets Market Movements Using Patterns And Trends On Price Charts.
👉👉👉Follow us for Live Market Views/Trades/Analysis/News Updates.
Sandhar TechnologyRSI based strategy
RSI taken support @ 40 on daily chart
Support 512
Resistance 530
once cross then expected level 603

Surya RoshniInside Bar Strategy
Taken support @ 21 EMA
Resistance 344
Support 328
RSI crossing above 60 on daily basis

Buying zone areaSupport and resistance trading strategy The most common trading strategy using support and resistance levels is buying (going long) when the price is closing in on the support level and selling (going short) when the price is moving closer to the resistance level.
2500 resistance if break then bullish till target
2200 is support bouncing area

krsnaa dignostickrsnaa dignostics looks good , minor hurdle at 740 if carried out than good move possible.

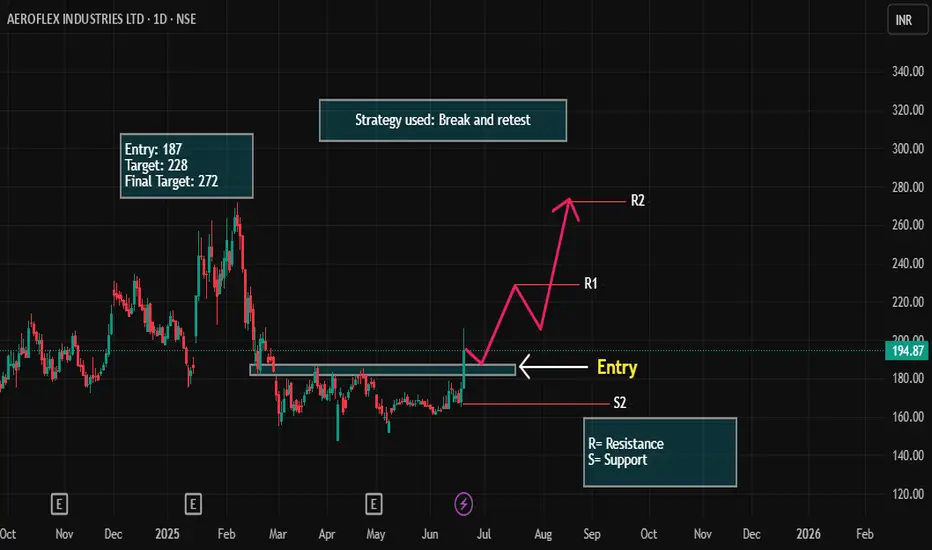
AEROFLEX LONG Setup!Stock: Aerofle (AERF)
Current Market Price (CMP): ₹194
Entry Point: ₹187
Target: ₹228
Final Target: ₹272
Stop Loss (SL): Below Support 2
Trade Setup with Stop Loss:
Entry at ₹187: As mentioned earlier, you plan to enter at ₹187, which is lower than the current market price of ₹194. You're waiting for a pullback to this level, anticipating the stock will rebound from this price and head higher.
Target at ₹228: This is your first price target, where the stock is expected to face resistance. Once the stock hits ₹228, it might experience some pullback or consolidation.
Final Target at ₹272: This is the key level where you're aiming for the stock to reach, assuming the trend continues. ₹272 is your ultimate exit target.
Stop Loss (SL) Below Support 2:
The stop loss is placed below Support 2, which is a lower level of support. By positioning the stop loss here, you're allowing for some price fluctuation, but you’re limiting your downside risk in case the trade doesn’t play out as expected. Support 2 serves as a critical level, and if the price falls below this, it could indicate a reversal or breakdown of the trend.
Why This Setup Works:
Support 2 is your safety net. If the stock breaks below this level, it suggests that the uptrend is invalidating, so exiting with minimal loss is a good risk management strategy.
You're using the break and retest strategy with Support 2 as a critical level to protect against a major downtrend. If the stock holds above ₹187 and moves up to ₹228 and beyond, your risk-to-reward setup is favorable.
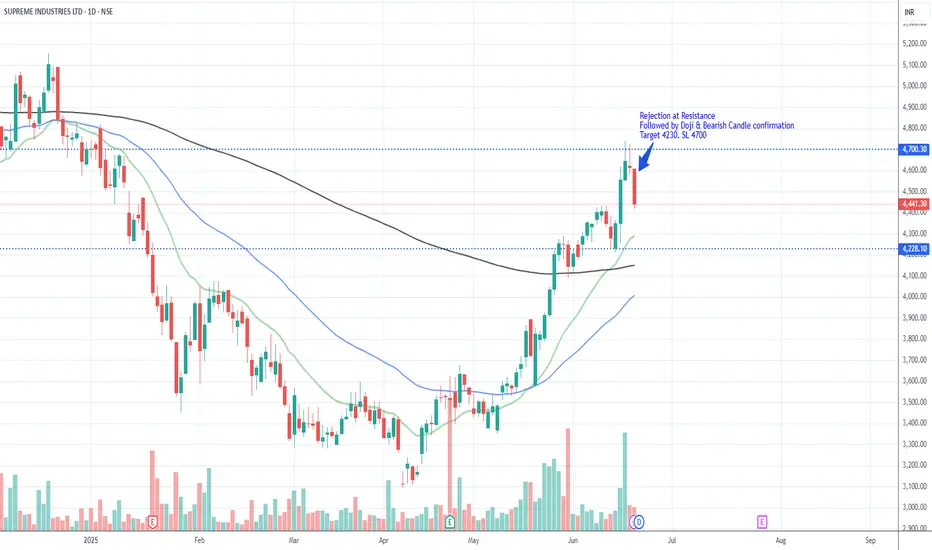
SupremeIND_Price rejection @ Resistance_ShortRejection at Resistance
Followed by Doji & Bearish Candle confirmation
Target 4230. SL 4700
Review and plan for 20th June 2025Nifty future and banknifty future analysis and intraday plan.
This video is for information/education purpose only. you are 100% responsible for any actions you take by reading/viewing this post.
please consult your financial advisor before taking any action.
----Vinaykumar hiremath, CMT

DRREDDY_Long_Bounce Back @ 20 Daily EMALooks Bullish.
Support near 20 DEMA
Bullish Engulfing Candle
Target 1360
SL Today's Low 1300
Enter when the Price makes Higher
low or tests the moving Avg

Tata Elxsi_Price Rejection With Bearish Engulfing Candle_ShortLooks Bearish
Bearish Engulfing candle
Breaks 200 DEMA & 20 DEMA

Astral_Price Rejection @ 200 Daily EMA_ ShortPrice rejection at 200 DEMA with Bearish Engulfing Pattern
Short when the risk (Entry Price to Stop Loss) is favorable.

Paytm_Rejection @ 20 & 50 Daily EMA_ShortPrice rejection at 20 DEMA and close below 50 DEMA
Short when the price favorable in lower timeframe (Swing high)
Target 825; SL- Today's High/ Close above 50 DEMA

Kaynes_Rejection at 20 Daily EMA_ShortPrice rejection from 20 DEMA and close below 50 DEMA.
Probable Short candidate. Target Previous Swing Low 5370
SL yesterday's high or close above 20 DEMA.
Enter only when the hourly chart pulls back

Tata Consumer product LTD- For swing tradeToday price has formed a good bullish Spining Top Marubozu candle with a good volume .
Price is also in its very important support level.
We can go for long trade if price closes above today high which is 1091.
Our 1st target will be 1130 and 2nd target will be 1170.
We can take a stop loss of 1060 (30 points).

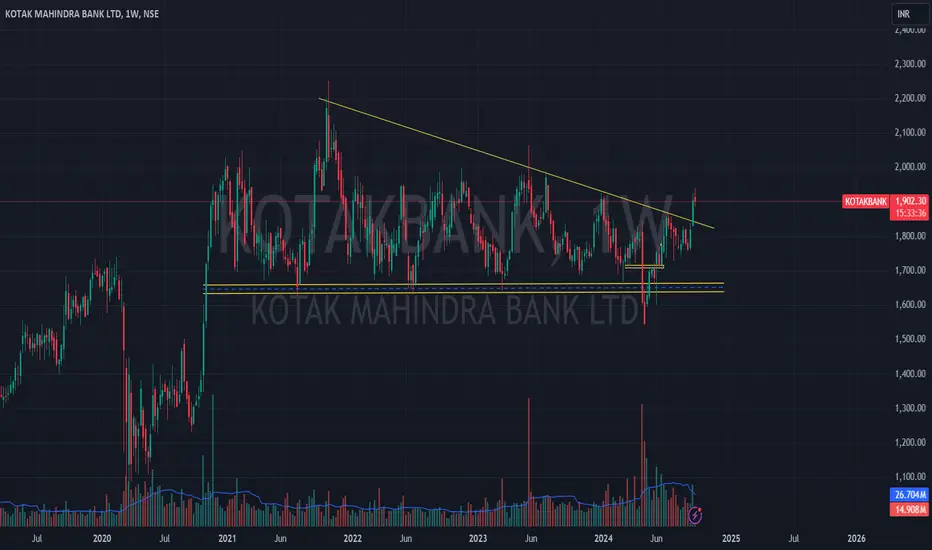
KOTAK BANK 1WKotak Mahindra Bank has recently experienced a bullish breakout, indicating a potential upward price movement. Based on technical analysis, the stock is projected to reach the 2400 price level in the near future
I'm not a SEBI-registered analyst. All posts and levels shared are just for educational purposes. I'm not responsible for any losses or profits. No claims, all rights reserved.
PTC Elliott Wave Count | ₹337 in Sight if ₹200 Breaks ✅ Elliott Wave Count (Verified & Explained)
The chart presents a classic 5-wave impulsive Elliott Wave structure:
Wave 1: Initial rally, confirmed by a clear breakout.
Wave 2: Deep retracement to ~0.786 Fib (around ₹106.95) — valid corrective wave.
Wave 3: Strong rally to ₹318.15 — the longest wave, typical of Wave 3.
Wave 4: Corrective phase, consolidating sideways (drawn in a yellow box) — does not overlap Wave 1 top, which confirms its validity.
Wave 5 (projected): A potential rally to ₹337+, indicated by the orange trendline and Fibonacci projections.
🔍 Fibonacci Levels (Correctly Plotted)
0.618 Retracement from Wave 2 low to Wave 3 top aligns well at ₹137.69 (respected during pullback).
1.618 Extension of Wave 1 from Wave 2 gives ₹248.88, and 100% extension at ₹318.15 (already hit by Wave 3).
Final Wave 5 Target projected near ₹337.15.
📊 Technical Indicators (RSI + Volume)
RSI (14): Currently at 49.30, slightly bearish-neutral. The RSI-MA is at 53.99, suggesting minor divergence or consolidation.
Volume: Lower than peak Wave 3 volume, but not dried up — indicating consolidation or accumulation during current phase.
⚠️ Observations / Mistakes
✅ Elliott Wave Count is technically valid — follows rules (Wave 3 not the shortest, Wave 4 doesn't enter Wave 1 zone).
✅ Fibonacci levels are accurate and meaningful.
⚠️ Wave 5 projection line is hypothetical; current price action still hasn’t broken above consolidation zone (~₹180–200). A confirmed breakout with volume is needed.
🧾 Summary (For TradingView Description)
PTC India Ltd – Weekly Elliott Wave + Fibonacci Analysis
A textbook 5-wave Elliott impulse is unfolding. Wave 4 appears completed after a long consolidation.
Wave 5 targets ₹337, with intermediate resistances near ₹248 and ₹318 based on Fibonacci projections.
RSI is neutral but showing signs of recovery; a break above ₹200 with volume can trigger Wave 5.
Investors can watch for breakout confirmation with stop-loss below Wave 4 low (~₹130).
🔸 Bias: Moderately Bullish (awaiting breakout confirmation)
🔸 Invalidation: Below ₹130 (Wave 4 low)

ARMANFIN Long IdeaARMANFIN chart looks strong. It is in uptrend and going towards ATH.
Supports and Targets are given in Chart.
Risk management is Important.
pro's : Repo Rate fallen down. Overall MFI space is better than previous quarters.
Con's : ArmanFinancial has no growth guidnace for FY26. They are in Asset Quality management currently.

