Tata Elxsi_Price Rejection With Bearish Engulfing Candle_ShortLooks Bearish
Bearish Engulfing candle
Breaks 200 DEMA & 20 DEMA

Astral_Price Rejection @ 200 Daily EMA_ ShortPrice rejection at 200 DEMA with Bearish Engulfing Pattern
Short when the risk (Entry Price to Stop Loss) is favorable.

Paytm_Rejection @ 20 & 50 Daily EMA_ShortPrice rejection at 20 DEMA and close below 50 DEMA
Short when the price favorable in lower timeframe (Swing high)
Target 825; SL- Today's High/ Close above 50 DEMA

Kaynes_Rejection at 20 Daily EMA_ShortPrice rejection from 20 DEMA and close below 50 DEMA.
Probable Short candidate. Target Previous Swing Low 5370
SL yesterday's high or close above 20 DEMA.
Enter only when the hourly chart pulls back

Tata Consumer product LTD- For swing tradeToday price has formed a good bullish Spining Top Marubozu candle with a good volume .
Price is also in its very important support level.
We can go for long trade if price closes above today high which is 1091.
Our 1st target will be 1130 and 2nd target will be 1170.
We can take a stop loss of 1060 (30 points).

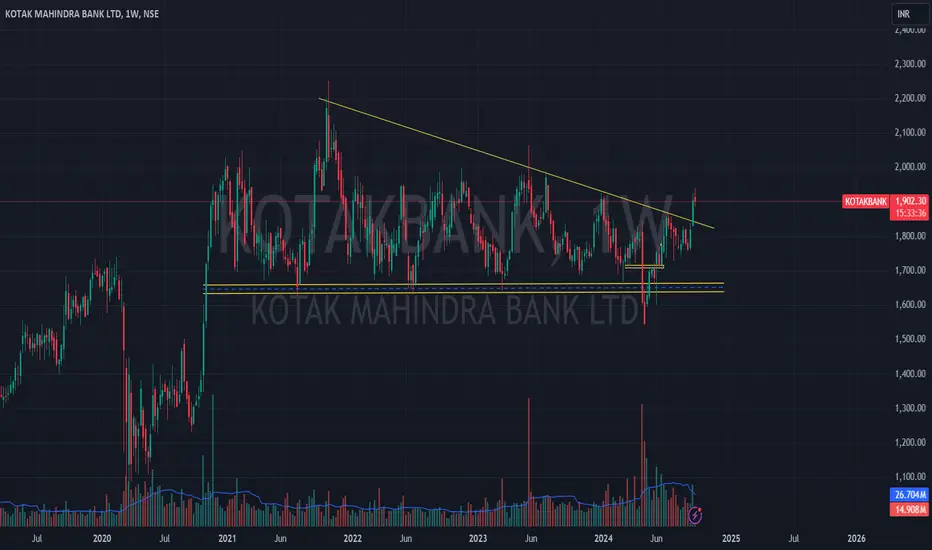
KOTAK BANK 1WKotak Mahindra Bank has recently experienced a bullish breakout, indicating a potential upward price movement. Based on technical analysis, the stock is projected to reach the 2400 price level in the near future
I'm not a SEBI-registered analyst. All posts and levels shared are just for educational purposes. I'm not responsible for any losses or profits. No claims, all rights reserved.
PTC Elliott Wave Count | ₹337 in Sight if ₹200 Breaks ✅ Elliott Wave Count (Verified & Explained)
The chart presents a classic 5-wave impulsive Elliott Wave structure:
Wave 1: Initial rally, confirmed by a clear breakout.
Wave 2: Deep retracement to ~0.786 Fib (around ₹106.95) — valid corrective wave.
Wave 3: Strong rally to ₹318.15 — the longest wave, typical of Wave 3.
Wave 4: Corrective phase, consolidating sideways (drawn in a yellow box) — does not overlap Wave 1 top, which confirms its validity.
Wave 5 (projected): A potential rally to ₹337+, indicated by the orange trendline and Fibonacci projections.
🔍 Fibonacci Levels (Correctly Plotted)
0.618 Retracement from Wave 2 low to Wave 3 top aligns well at ₹137.69 (respected during pullback).
1.618 Extension of Wave 1 from Wave 2 gives ₹248.88, and 100% extension at ₹318.15 (already hit by Wave 3).
Final Wave 5 Target projected near ₹337.15.
📊 Technical Indicators (RSI + Volume)
RSI (14): Currently at 49.30, slightly bearish-neutral. The RSI-MA is at 53.99, suggesting minor divergence or consolidation.
Volume: Lower than peak Wave 3 volume, but not dried up — indicating consolidation or accumulation during current phase.
⚠️ Observations / Mistakes
✅ Elliott Wave Count is technically valid — follows rules (Wave 3 not the shortest, Wave 4 doesn't enter Wave 1 zone).
✅ Fibonacci levels are accurate and meaningful.
⚠️ Wave 5 projection line is hypothetical; current price action still hasn’t broken above consolidation zone (~₹180–200). A confirmed breakout with volume is needed.
🧾 Summary (For TradingView Description)
PTC India Ltd – Weekly Elliott Wave + Fibonacci Analysis
A textbook 5-wave Elliott impulse is unfolding. Wave 4 appears completed after a long consolidation.
Wave 5 targets ₹337, with intermediate resistances near ₹248 and ₹318 based on Fibonacci projections.
RSI is neutral but showing signs of recovery; a break above ₹200 with volume can trigger Wave 5.
Investors can watch for breakout confirmation with stop-loss below Wave 4 low (~₹130).
🔸 Bias: Moderately Bullish (awaiting breakout confirmation)
🔸 Invalidation: Below ₹130 (Wave 4 low)

ARMANFIN Long IdeaARMANFIN chart looks strong. It is in uptrend and going towards ATH.
Supports and Targets are given in Chart.
Risk management is Important.
pro's : Repo Rate fallen down. Overall MFI space is better than previous quarters.
Con's : ArmanFinancial has no growth guidnace for FY26. They are in Asset Quality management currently.


$NSE:ETERNAL To SkyRocket in the Coming Days !NSE:ETERNAL
Very Good Price Action is Already Formed.
Its the Time to make Accumulations of Stock near the Current price.
Its The Company, Which Goin to Cater Services the Future.
Its Now or Never !
Boost the idea ! Pal

EQUITAS BANK-NO BRAINER ??!!
Trend & Structure:
Price has broken out of a long-term falling trendline, indicating a potential trend reversal.
Immediate resistance at ₹65 has been cleared, suggesting bullish momentum.
Breakout level is marked and retested, forming a higher low, adding confirmation to the uptrend.
Volume:
Breakout is accompanied by rising volume, a positive sign of strength and confirmation of buyer interest.
RSI (14):
RSI is currently at 67.28, approaching the overbought zone (above 70).
No visible bearish divergence yet, but worth watching near ₹88 levels.
Key Levels:
✅ Support: ₹60 (strong base, also marked as Stoploss)
✅ Breakout Level: Around ₹65 (previous resistance, now support)
🚩 Next Resistance Zones:
₹88 (significant supply zone)
₹111 (major resistance)
✅ What's Good (Strengths):
Clear breakout above trendline and prior resistance.
Volume confirms breakout strength.
RSI shows momentum favoring bulls.
Well-marked stop loss and resistance levels.
Price action forming higher lows and attempting to form higher highs – early sign of uptrend initiation.

Alkem- Healthy Correction, Strong Base – Poised for Final wave!ALKEM LABORATORIES – Weekly Elliott Wave View
The chart presents a clear 5-wave Elliott impulse in progress. Wave 4 appears to be completed or near completion, resting at the golden 0.618 Fib level of Wave 3. The broader uptrend remains intact inside the long-term channel.
Key Levels:
Support: ₹4,475 – ₹3,956
Resistance: ₹5,272, ₹6,439, ₹6,700, and ₹8,407 (Wave 5 projection)
RSI at 40.58 indicates consolidation but signs of bullish divergence are emerging. A strong bounce from current support could trigger Wave 5 toward new highs.
Bias: Bullish | Awaiting Wave 5 Initiation

TATA- ko"bye-bye"bolna mana hain!!The structure suggests a completed Wave 4 correction at 0.5–0.618 Fibonacci retracement, setting up for the final Wave 5 leg. A bullish reversal is underway, supported by improving RSI and rising volume.
Key Levels:
Support: ₹603, ₹500, ₹465
Resistance: ₹725 (Fib), then new highs
RSI at 42.6 shows early bullish momentum. A weekly close above ₹725 could confirm Wave 5 ignition toward potential new highs.
Bias: Bullish | Wave 5 in Progress

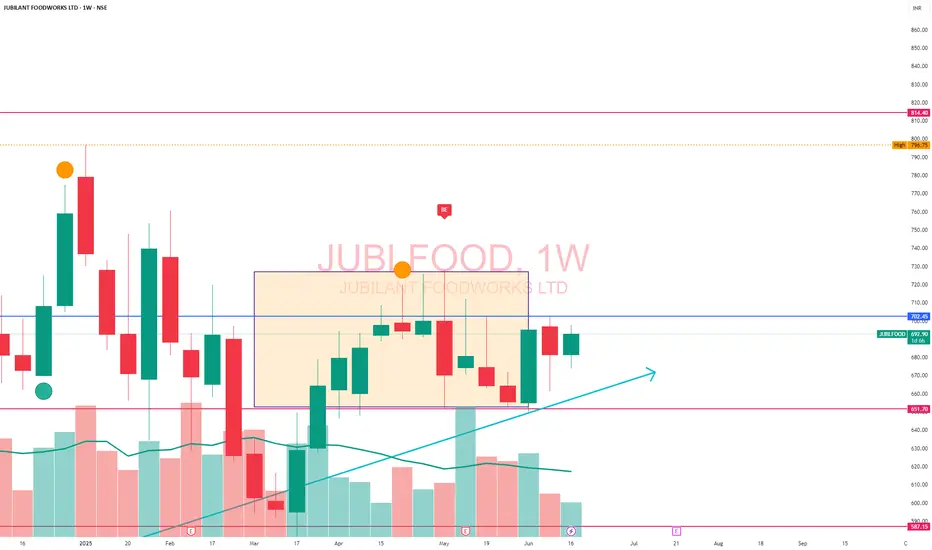
JUBLFOODJubilant Food is looking good on Weekly chart frame, Trade can be taken above 700, 10,20,20, points can be earned in shorts span.
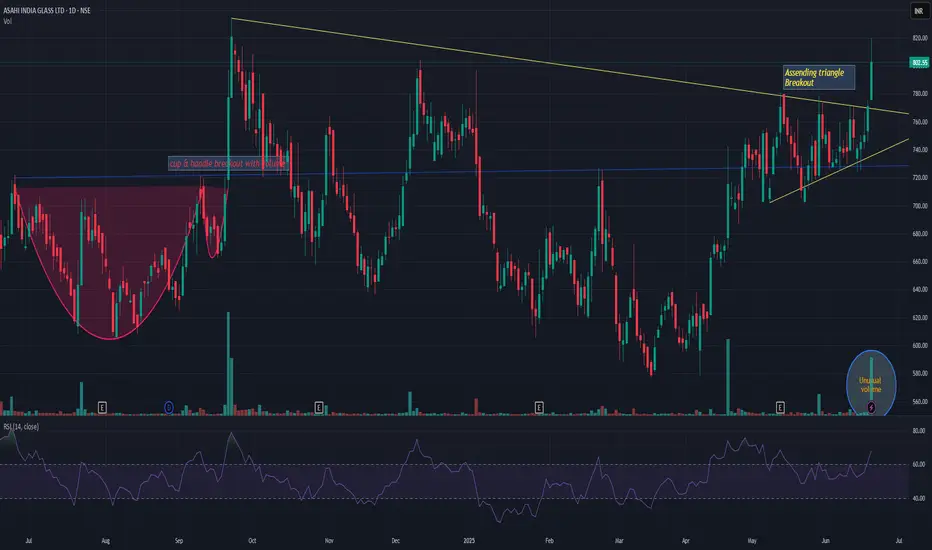
ASAHIINDIAASAHIINDIA has given symmetrical triangle breakout with unusual volume. Already took a momentum. Now as long as it is above upper channel line, i believe the momentum will continue till 980-1000 levels. Keep it on radar.
KBCGLOBAL Looks bullish!A potential entry is identified at 0.46. The first target is 0.62, representing a +34.78% gain from the entry point. If the upward momentum continues, the long-term target is set at 0.87, offering a total potential gain of +89.13% from the initial entry. This trade presents a strong risk-to-reward profile for both short-term traders and long-term investors. Proper risk management is essential, especially if price action weakens below the entry level.

Trade setup HINDZINCHINDZINC Is approaching a key support level at 440. This level is critical for determining the stock's next move. A breakdown below 440 could signal increased bearish momentum, potentially leading to further downside. On the other hand, if the 440 level holds strong and shows signs of support, it could mark the beginning of a bullish reversal. In that case, there's a significant upside potential, with a possible long-term target around 655. For now, it's important to stay patient and wait for a clear signal—either a breakdown or a bounce from the current level—before making any trading decisions.

RELIANCE INFRASTRUCTU - Bullish Flag & Pole Breakout (Daily T/F)Trade Setup
📌 Stock: RELIANCE INFRASTRUCTU ( NSE:RELINFRA )
📌 Trend: Strong Bullish Momentum
📌 Risk-Reward Ratio: 1:3 (Favorable)
🎯 Entry Zone: ₹385.00 (Breakout Confirmation)
🛑 Stop Loss: ₹293 (Daily Closing Basis) (-23 % Risk)
🎯 Target Levels:
₹412.50
₹441.95
₹472.55
₹506.05
₹542.30
₹580.65
₹616.10
₹654.00 (Final Target)
Technical Rationale
✅ Bullish Flag & Pole Breakout - Classic bullish pattern confirming uptrend continuation
✅ Strong Momentum - Daily RSI > 60, Weekly RSI >60 Monthly rsi >60
✅ Volume Confirmation - Breakout volume 2.73M vs previous day's 2.69M
✅ Multi-Timeframe Alignment - Daily and weekly charts showing strength
Key Observations
• The breakout comes with significantly higher volume, validating strength
• Well-defined pattern with clear price & volume breakout
• Conservative stop loss at recent swing low
Trade Management Strategy
• Consider partial profit booking at each target level
• Move stop loss to breakeven after Target 1 is achieved
• Trail stop loss to protect profits as price progresses
Disclaimer ⚠️
This analysis is strictly for educational purposes and should not be construed as financial advice. Trading in equities involves substantial risk of capital loss. Past performance is not indicative of future results. Always conduct your own research, consider your risk appetite, and consult a financial advisor before making any investment decisions. The author assumes no responsibility for any trading outcomes based on this information.
What do you think? Are you watching NSE:RELINFRA for this breakout opportunity? Share your views in the comments!

Buy above 1350After consolidation stock is moving in an upward channel, currently stock is near the central area of the channel, immediate support for the stock is at 1280, next is at 1185 and zone at 1100-1130(gap filling zone), target is 1395, 1485 and 1590-1600, which can be resistance for the stock as well. On weekly TF stock formed wild upper shadow, and looks neutral as of now.

Review and plan for 19th June 2025Nifty future and banknifty future analysis and intraday plan.
This video is for information/education purpose only. you are 100% responsible for any actions you take by reading/viewing this post.
please consult your financial advisor before taking any action.
----Vinaykumar hiremath, CMT

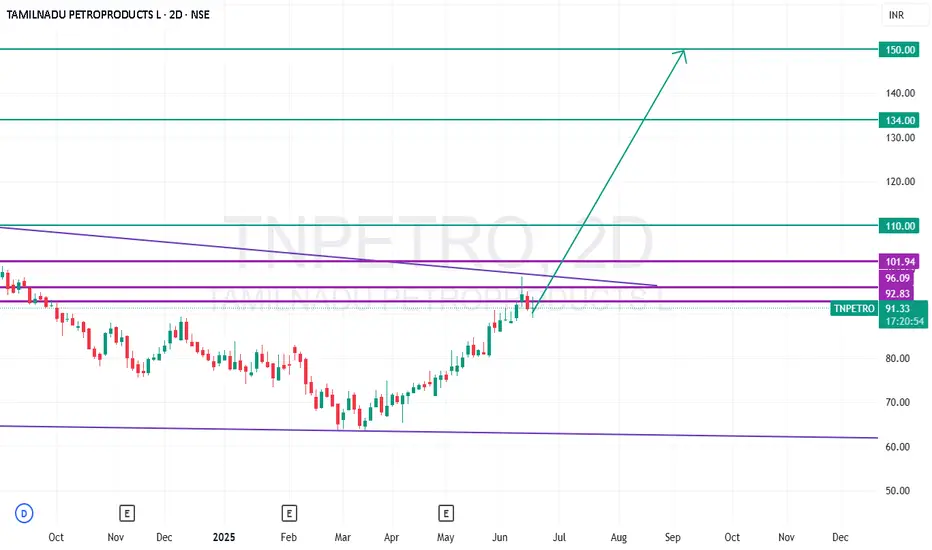
TNPETRO - Long*TN Petro - CMP - 91.30 / Positional Trade*
*Buy Range 90 to 92 ONLY / Stop Loss 80 in weekly candle closing*
*Target 1 - 110*
*Target 2 - 120*
*Target 3 - 134 / 150+*
Disclaimer: This is my view and for educational purpose only.
Magellanic Cloud Ltd – 4H Chart Analysis📊 Summary:
A cup and handle pattern appears to have broken out but is now retesting the breakout zone. Price is hovering around support at ₹74–75, but weakness is creeping in, with RSI below 41 and declining momentum.
🔍 Technical Insights:
Pattern: Classic Cup & Handle breakout, but failed to sustain.
Trendline Breakdown: The upward sloping trendline has been breached, signaling possible short-term weakness.
Key Support: ₹74–75 zone (previous breakout resistance).
Resistance Zone: ₹84.50 (recent swing high).
Volume: Declining – indicates lack of buying conviction.
RSI: 40.81 (Bearish momentum), below its moving average (50.41).
✅ Suggestions:
⚠️ For Existing Positions:
Tighten stoploss to below ₹74 (next major support).
Watch price action near ₹74–75. A decisive close below this could drag price toward ₹68 or lower.
🛒 For New Entry (Long):
Avoid fresh entry now unless it reclaims the trendline and ₹78+ with strong volume.
Consider buying only on:
RSI recovery above 50
Price reclaiming ₹78 with bullish candle
🧯 If Support Breaks:
Watch next support at ₹68 and ₹63.
Avoid averaging down blindly unless volume confirms reversal.
📌 Conclusion:
Magellanic Cloud showed promise with a bullish setup, but trendline break and weak RSI point to possible correction or consolidation ahead. Only strength above ₹78 can revalidate the bullish case.
