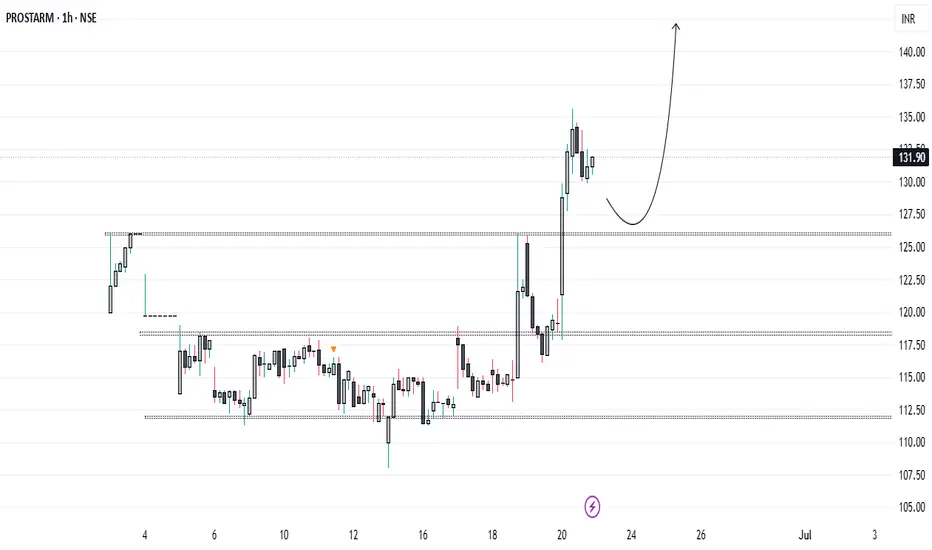
What’s Next for PROSTARM Investors...?Prostarm has decisively broken its all-time high. Since its IPO on June 3rd, it has successfully surpassed the major resistance level of 126 and is holding strong above it. We should take advantage of this opportunity and establish a long position on the retest of the 126 level.
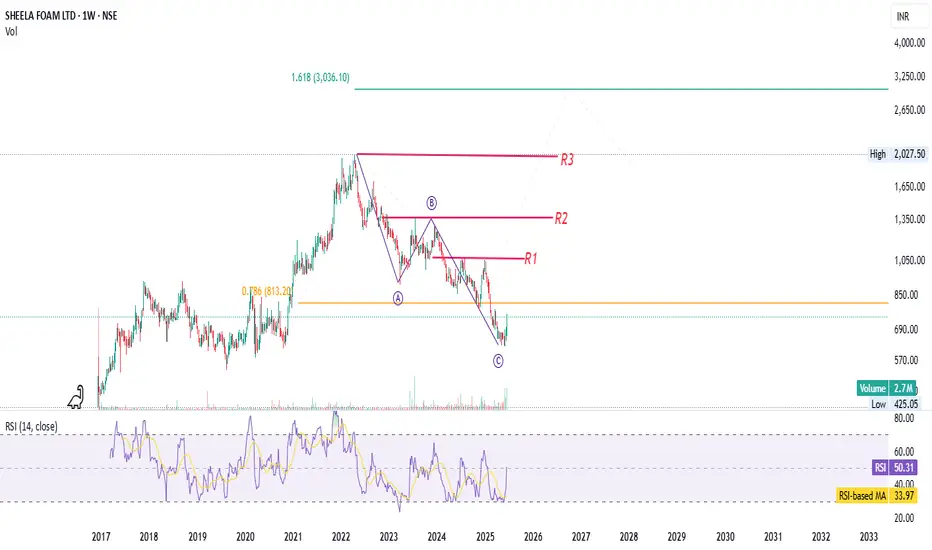
Sheela Foam | ABC Correction Likely CompleteStock: Sheela Foam Ltd
Chart Type: Weekly
Current Trend: Reversal from C-wave bottom, after long ABC correction.
Support: Strong base at Fib 0.786 (₹813.20).
Volume: Surge near point C adds confirmation.
RSI: Rising above 50 from oversold — bullish momentum starting.
📊 Resistance Levels:
R1 (₹1040–₹1150): First test of structure
R2 (₹1450–₹1550): Intermediate resistance near channel median
R3 (₹1800+): Major supply zone + Fib retracement + channel top
Jana SFB- Trendline Breakout + Base Formed –Fibonacci Extension Levels:
1.0 = ₹365.75 (key breakout base)
1.618 = ₹1,011.95 (potential target)
Horizontal Support: Around ₹365–₹370 (marked by prior structure & 1.0 Fib level)
Descending Trendline: Broken recently — this breakout indicates short-term reversal from downtrend.
Volume Spike: Circled area indicates high volume + price bounce = potential reversal confirmation.
Recent High: ₹495.35
Current Price: ₹486.75
🧠 Technical Observations:
Trend Shift:
Price has broken above a falling trendline and is now consolidating sideways above former resistance.
This suggests accumulation after a breakout.
Support Zones:
₹365–₹370 (Fibonacci 1.0 level + previous bottom) — very strong base support.
₹445–₹455 (recent consolidation zone) — short-term support.
Target Zones (Based on Fib Extension):
Mid-term: ₹565 (horizontal resistance)
Long-term: ₹760 (swing high)
Fib 1.618 target: ₹1,011.95 — optimistic projection, only valid in case of a strong trending move.
📉 RSI Analysis:
Current RSI: 45.87 — weak, slightly bearish bias.
RSI-based MA: 52.44 — RSI is below average, indicating loss of recent momentum.
However, no bearish divergence seen.
📌 Summary:
Trend: Shifted from downtrend to base-building and sideways consolidation.
Breakout Confirmation: Seen with volume near the circled support, followed by gradual up-move.
Current Phase: Likely accumulation/consolidation before the next move.
Trigger Levels:
Break above ₹500 could reignite bullish momentum.
Hold above ₹445–₹455 is crucial to sustain structure.

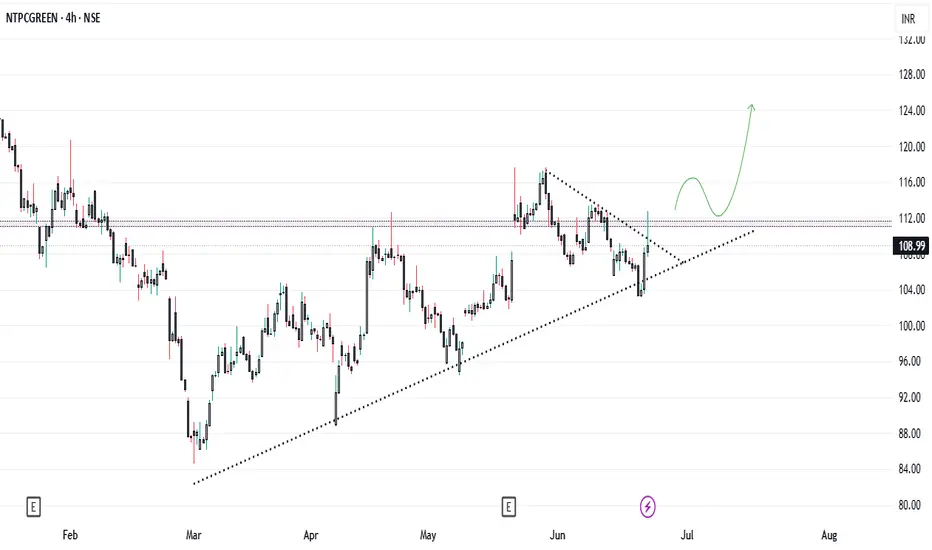
What’s the Next Move for NTPC Green...?NTPC GREEN is currently in a symmetrical pattern and is encountering resistance at the crucial level of 112. If it breaks through this resistance and the triangle while sustaining above 112, we will likely see a significant price increase.
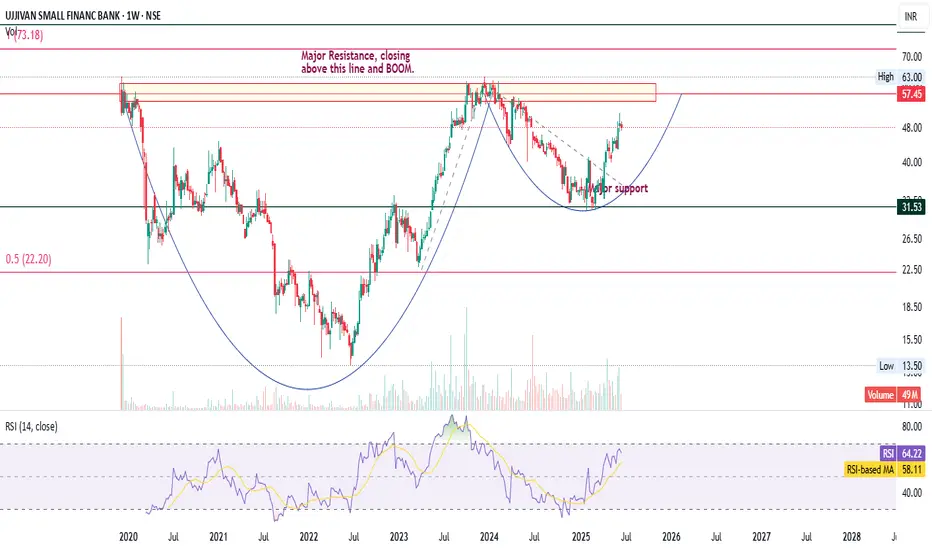
Ujjivan SFB | Cup & Handle Breakout Setup Brewing – Watch✅ Pattern Recognition & Price Structure:
Cup and Handle Formation:
Two distinct cup-like bases are forming a larger “Double Cup & Handle” structure — a strong bullish continuation pattern.
First cup (2020–2023): Already completed with breakout above mid-point neckline.
Second cup (2023–2025): Currently approaching breakout zone.
📌 Key Levels:
Major Resistance Zone: ₹57.45 – ₹63.00
Labeled as “Major Resistance, closing above this line and BOOM” — breakout above this level may trigger a strong upward momentum.
Support Levels:
₹48.00: Current price zone acting as intermediate support.
₹31.53: Previous base — strong historical support.
₹22.20: 50% retracement level of a prior swing (Fibonacci).
🔍 Volume Analysis:
Noticeable volume pickup during recent rally — suggests accumulation and bullish interest.
Current volume: 49M
📈 RSI (Relative Strength Index):
RSI (14): 64.22 → Bullish Momentum, not yet overbought.
RSI is above RSI-based MA (58.11), confirming positive momentum and trend continuation.
📝 Summary & Outlook:
Structure suggests a long-term bullish setup with high potential if the ₹57.45–₹63.00 zone is breached.
RSI supports bullish strength; volume supports accumulation.
Closing above ₹63 could confirm the breakout from the larger cup & handle pattern — a BOOM scenario as marked.
⚠️ Caution/Watchpoints:
Resistance zone around ₹57.45–₹63 is critical — repeated rejection here can cause short-term pullbacks.
Watch RSI for any divergence near breakout zone.
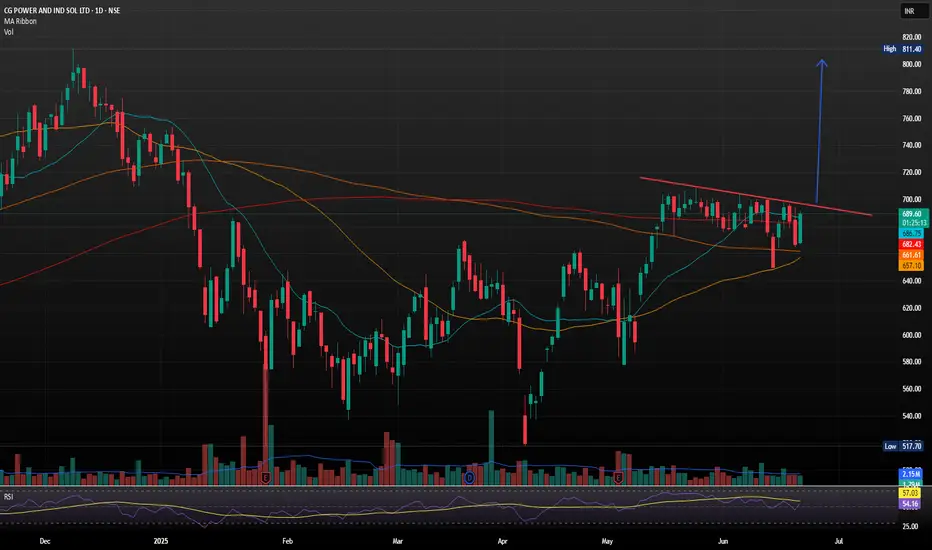
CG Power and Industrial Solutions with Strong Bullish Flag SetupCG Power and Industrial Solutions just landed its largest-ever single order a 641 crore contract from Power Grid Corporation of India Ltd (PGCIL) for high-voltage transformers and reactors
The company, now under the Murugappa Group, reported consolidated FY25 revenues of 9,909 crore. However, annual profit dipped to 972.98 crore from 1,427.61 crore in FY24, despite a strong Q4 showing with a 17% YoY rise in net profit to 274.26 crore.
- Inverse Head & Shoulders Breakout: The stock recently broke out of an inverse H&S pattern, a classic bullish reversal signal, with strong volume confirmation. Holding above 690 could push it toward 750 TO 800.
Support & Resistance Levels
- Support: 663–679 demand zone
- Resistance: 694, 704 and 712
Trend Summary
- Short-Term: Neutral to bullish
- Medium-Term: Bullish bias if it sustains above 690
- Volatility: Elevated, so expect sharp swings
WELCORP - A case study in smart money accumulationHypothesis:
Historically, metal stocks have shown strong rallies following interest rate cuts. This is based on the premise that lower rates stimulate economic activity, driving demand for industrial metals and commodities. With the potential for a rate-cut cycle on the horizon, this creates an actionable setup for accumulation before a broader uptrend unfolds.
Strategy: “Accumulate the Red”
We propose an accumulation strategy tailored for this macro setup:
Accumulate 5–10% of your intended position on every red daily candle where the stock declines by more than 1%.
This allows for scaling into weakness, which historically has provided the best reward-to-risk entry points in these cyclical turnarounds.
Why This Works
Macro Tailwinds: Once interest rates peak, the cost of capital drops, benefiting infrastructure and industrial sectors.
Sentiment Mismatch: Market tends to remain overly bearish during the initial leg of a pivot, creating undervaluation.
Risk Management: Accumulating on red candles avoids chasing momentum and distributes entry risk.

WAAREEENER | Risk-Takers Buy @LTP, Safer Entry Above 3120Disclaimer:
This is not financial advice. Please do your own research or consult with a financial advisor before making any investment decisions. Investments in stocks can be risky and may result in loss of capital.

MaxHealth might be the source of your wealthBeautiful Contractions at 50 DMA. Good Prior Uptrend, Rising RS over the last year. Sector is coming out of base as well. Look at the Price Volume action - lower volumes at every down move.

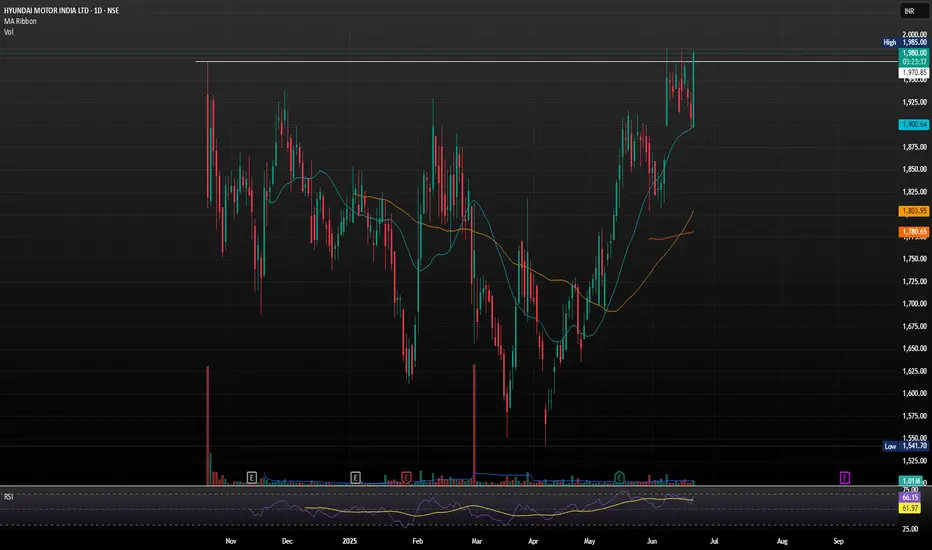
HYUNDAI - Moving above IPO priceAuto's are trying to make a come back and Hyundai is looking to lead it from the front. All time high was made recently. Ideal entry should be on a pullback

WAAREEENER - Clear VCP in formationPivots marked on charts.
Price above 50 DMA. Volumes are healthy.
Needs one more strong daily candle that closes above the first pivot to mark entry. Positions can be scaled in 33% at a time on breach of each pivot. Hold till HH-HL trend is intact.

Clear Buy side from this range In Day frame chart we can see a big consolidation happening from last few days or months its a great opportunity to buy in dips and hold atleast for 3M. Also stock is getting at more than 35% discounted rate

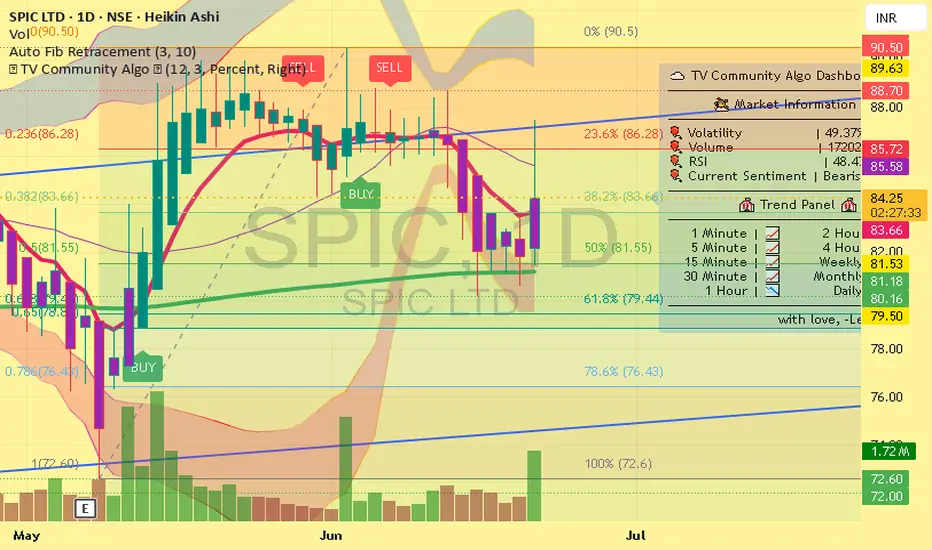
buy SPIC for target 170buy SPIC with SL 79 for the target of 170 time horizon next 2 qtr , position built with strict sl , above 90 monthly closing may add fire in it, 3 yrs symtirical triangle breakout expected. early monsoon, israel iran clash, demand supply, gap can reason for it, and chart support it.
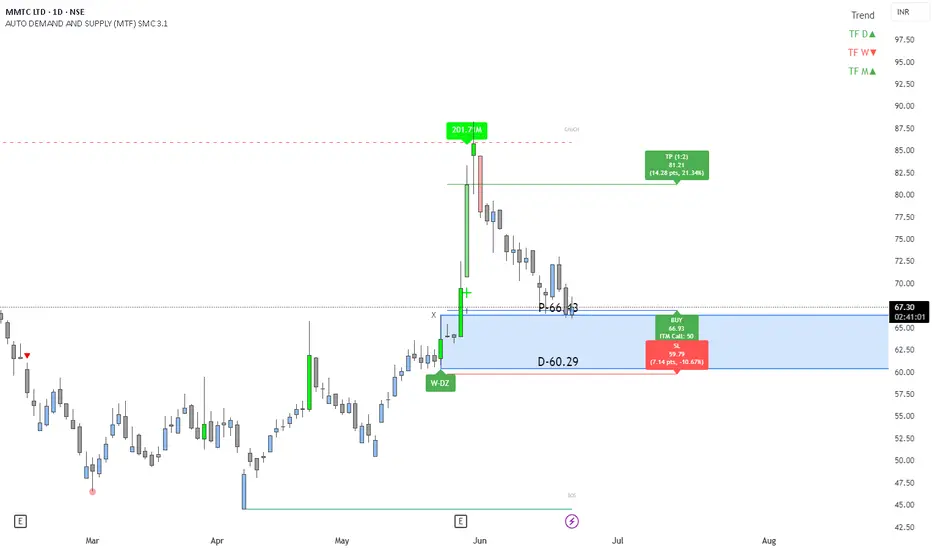
MMTC : Weekly Demand zone Long trade area market structurekey highlights : MMTC : Weekly Demand zone Long trade area market structure : Bullish Analysis Time frame :
Weekly proximal line - 66.43
distal line - 60.29
Buy entry - 66.90
Stop loss- 59.79
Target - 81.21
SPIC--compulsive buyA good fertilizer stock trading near to 200 days EMA . Low PE of 11.2 intrinsic value of 196 making rounded bottom with higher low and higher high with second inverse head and shoulder in making . we have a minimum target of 115-120 resistance on weekly chart if breaks out then higher target of 135-50 range

SBI Card : Almost at the Sell Signal. Fingers Crossed SBI Card : Almost at the Sell Signal. Fingers Crossed .
( Not a Buy / Sell Recommendation
Do your own due diligence ,Market is subject to risks, This is my own view and for learning only .)

Wipro : Momentum continues after a buy signal
Wipro : Momentum continues after a buy signal .
Watch out for a major Red Band Resistance.
( Not a Buy / Sell Recommendation
Do your own due diligence ,Market is subject to risks, This is my own view and for learning only .)

HYUNDAI MOTORS LTD BREACHING ATHHyundai Motor India is one of the leading car manufacturers in the country, known for its wide range of vehicles—from hatchbacks and sedans to SUVs and electric cars. Some of its most popular models include the Creta, Venue, Verna, and the all-electric Ioniq 5.
If Hyundai Motor India has broken past the 2000 mark it may setting their sights even higher. UBS has issued the most bullish call so far, with a target of 2350, citing strong capacity expansion, export momentum, and premium product positioning. Other projections suggest a broader range between 2291 and 2328, depending on market conditions and quarterly performance.
Mahindra & Mahindra : Sitting at a Red band resistance Mahindra & Mahindra : Sitting at a Red band resistance
( Not a Buy / Sell Recommendation
Do your own due diligence ,Market is subject to risks, This is my own view and for learning only .)

IDFC First : Red band resistance
IDFC First : Red band resistance
( Not a Buy / Sell Recommendation
Do your own due diligence ,Market is subject to risks, This is my own view and for learning only .)

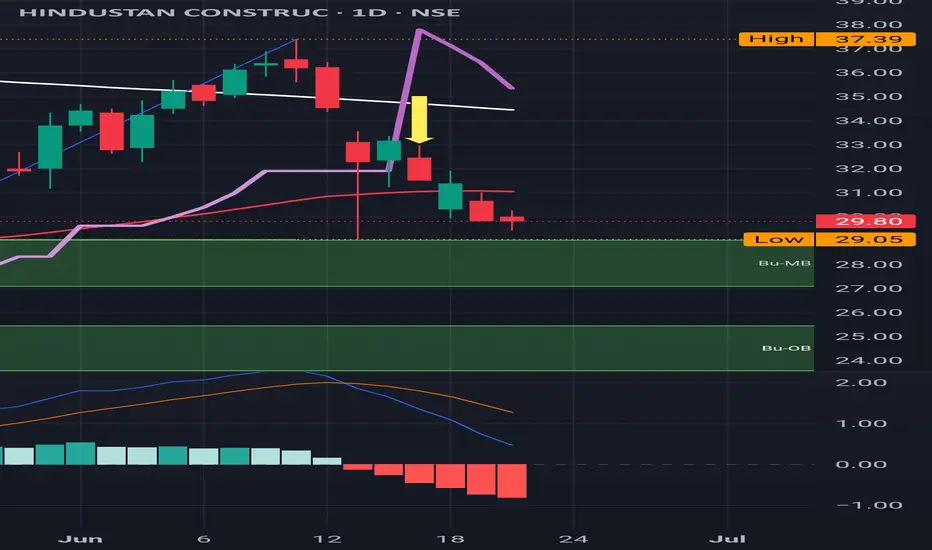
HCC : Downward trend continue after a Sell Signal HCC : Downward trend continue after a Sell Signal .
29 is a nearby Support level to be watched out for .
23 is a major support level which is bit far from the current level.
( Not a Buy / Sell Recommendation
Do your own due diligence ,Market is subject to risks, This is my own view and for learning only .)
MEGASTAR FOODS LTD S/RSupport and Resistance Levels:
Support Levels: These are price points (green line/shade) where a downward trend may be halted due to a concentration of buying interest. Imagine them as a safety net where buyers step in, preventing further decline.
Resistance Levels: Conversely, resistance levels (red line/shade) are where upward trends might stall due to increased selling interest. They act like a ceiling where sellers come in to push prices down.
Breakouts:
Bullish Breakout: When the price moves above resistance, it often indicates strong buying interest and the potential for a continued uptrend. Traders may view this as a signal to buy or hold.
Bearish Breakout: When the price falls below support, it can signal strong selling interest and the potential for a continued downtrend. Traders might see this as a cue to sell or avoid buying.
MA Ribbon (EMA 20, EMA 50, EMA 100, EMA 200) :
Above EMA: If the stock price is above the EMA, it suggests a potential uptrend or bullish momentum.
Below EMA: If the stock price is below the EMA, it indicates a potential downtrend or bearish momentum.
Trendline: A trendline is a straight line drawn on a chart to represent the general direction of a data point set.
Uptrend Line: Drawn by connecting the lows in an upward trend. Indicates that the price is moving higher over time. Acts as a support level, where prices tend to bounce upward.
Downtrend Line: Drawn by connecting the highs in a downward trend. Indicates that the price is moving lower over time. It acts as a resistance level, where prices tend to drop.
Disclaimer:
I am not a SEBI registered. The information provided here is for learning purposes only and should not be interpreted as financial advice. Consider the broader market context and consult with a qualified financial advisor before making investment decisions.

KFINTECHAlmost 35%+ corrected from Top Line: 1641, There are good buildup showing in 1day chart frame from bottom line 1034...
Keep it on radar, it will surely blast in few weeks... Strong fundamental and Q3FY25 result was excellent..
