Review and plan for 17th June 2025 Nifty future and banknifty future analysis and intraday plan.
Swing trading ideas.
This video is for information/education purpose only. you are 100% responsible for any actions you take by reading/viewing this post.
please consult your financial advisor before taking any action.
----Vinaykumar hiremath, CMT


#INDHOTEL - Pivot Point is 759.58Date: 29-05-2025
#INDHOTEL - Pivot Point is 759.58
Current Price: 760.55
Upside Targets: 799.20, 819.88, 842.49 and 865.10
Downside Targets: 720.03, 699.28, 676.66 and 654.05
Support: 740.78
Resistance: 778.52

INFOSYS 📊 Chart Analysis – Infosys Ltd (INFY)
Currently, the stock is testing a key resistance zone between ₹1620–₹1630.
If the price breaks and closes above this resistance, it can signal a strong bullish breakout.
---
💼 Trade Setup (Based on Cup and Handle Pattern):
Entry (Buy): On a closing above ₹1640
Stop Loss: ₹1570
Target 1: ₹1700
Target 2: ₹1780
---
This is a classic Cup and Handle breakout setup, which often indicates the start of an upward trend.
If you find this helpful and want more FREE forecasts in TradingView, Hit the 'BOOST' button
Drop some feedback in the comments below! (e.g., What did you find most useful?
How can we improve?)
Your support is appreciated!
Now, it's your turn!
Be sure to leave a comment; let us know how you see this opportunity and forecast.
Have a successful week
DISCLAIMER: I am NOT a SEBI registered advisor or a financial adviser. All the views are for educational purpose only

KAYNES | Buy @LTP | SL below 5000 | Targets 6250, 6835, 7760Disclaimer:
This is not financial advice. Please do your own research or consult with a financial advisor before making any investment decisions. Investments in stocks can be risky and may result in loss of capital.

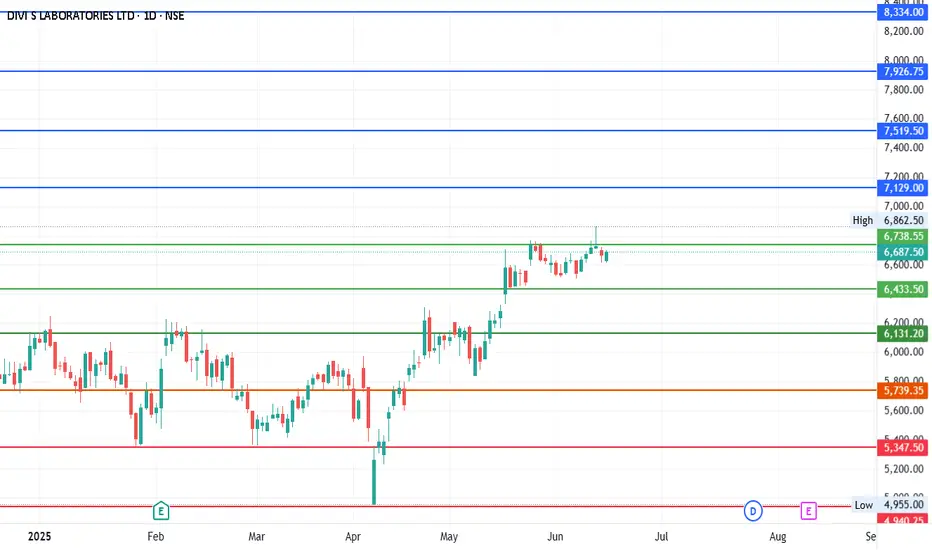
#DIVISLAB - Pivot Point is 6433.50Date: 20-05-2025
#Divislab Current Price: 6483
Pivot Point: 6433.50 Support: 6131.19 Resistance: 6738.53
#Divislab Upside Targets:
Target 1: 7129.01
Target 2: 7519.50
Target 3: 7926.75
Target 4: 8334.00
#Divislab Downside Targets:
Target 1: 5739.35
Target 2: 5347.5
Target 3: 4940.25
Target 4: 4533.00
#DIVISLAB - 1000 POINTS MOVE EXPECTEDCurrent Price: 5942
Upside: 6456.34 6697.75 6954.63 7211.50
Downside: 5570.02 5327.75 5070.88 4814.00
Checkout all the levels marked in the chart
Pls comment whatever you observe.

HAL - Target 3839.40 or 6159.20 ?Date: 19-05-2025
#HAL Current Price: 5016.3
Mid-Point: 4999.30
Upside Targets: 5426.46, 5662.10, 5910.65 and 6159.20
Downside Targets: 4572.97,4336.50, 4087.95 and 3839.40
Support: 4809.43
Resistance: 5190.83
#HAL
#HALChartAnalysis
#HALChartPatterns

MPHASIS | Buy @LTP | SL below 2580 | Targets 3250, 3500Disclaimer:
This is not financial advice. Please do your own research or consult with a financial advisor before making any investment decisions. Investments in stocks can be risky and may result in loss of capital.

KPITTECH | Buy @LTP | SL below 1300 | Targets 1740, 1900Disclaimer:
This is not financial advice. Please do your own research or consult with a financial advisor before making any investment decisions. Investments in stocks can be risky and may result in loss of capital.


NAZARA TECHNOLOGIES LTD S/RSupport and Resistance Levels:
Support Levels: These are price points (green line/shade) where a downward trend may be halted due to a concentration of buying interest. Imagine them as a safety net where buyers step in, preventing further decline.
Resistance Levels: Conversely, resistance levels (red line/shade) are where upward trends might stall due to increased selling interest. They act like a ceiling where sellers come in to push prices down.
Breakouts:
Bullish Breakout: When the price moves above resistance, it often indicates strong buying interest and the potential for a continued uptrend. Traders may view this as a signal to buy or hold.
Bearish Breakout: When the price falls below support, it can signal strong selling interest and the potential for a continued downtrend. Traders might see this as a cue to sell or avoid buying.
MA Ribbon (EMA 20, EMA 50, EMA 100, EMA 200) :
Above EMA: If the stock price is above the EMA, it suggests a potential uptrend or bullish momentum.
Below EMA: If the stock price is below the EMA, it indicates a potential downtrend or bearish momentum.
Trendline: A trendline is a straight line drawn on a chart to represent the general direction of a data point set.
Uptrend Line: Drawn by connecting the lows in an upward trend. Indicates that the price is moving higher over time. Acts as a support level, where prices tend to bounce upward.
Downtrend Line: Drawn by connecting the highs in a downward trend. Indicates that the price is moving lower over time. It acts as a resistance level, where prices tend to drop.
Disclaimer:
I am not a SEBI registered. The information provided here is for learning purposes only and should not be interpreted as financial advice. Consider the broader market context and consult with a qualified financial advisor before making investment decisions.

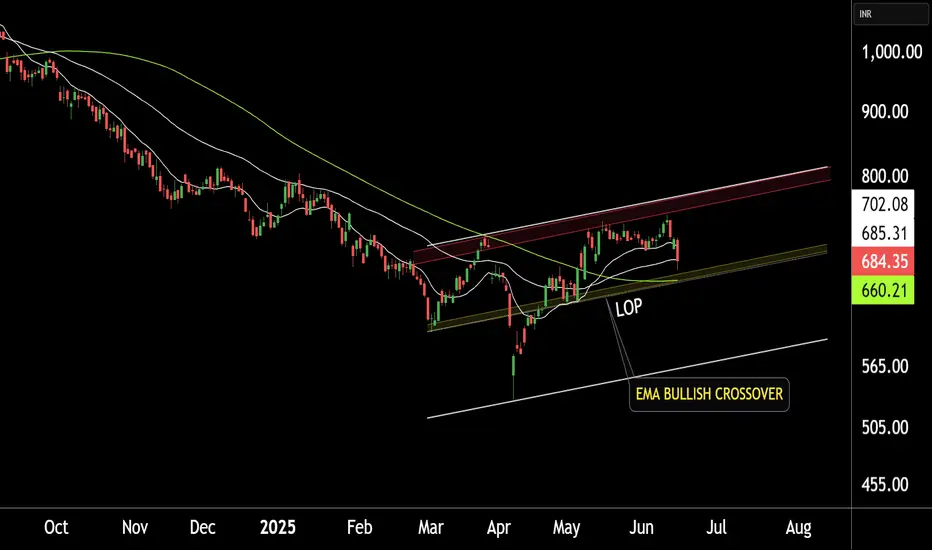
TATA MOTORS LTD at BEST SUPPORT !!This is the Daily chart of TATA MOTORS LTD.
TATA MOTORS having good law of polarity at 660 range.
TATAMOTORS has given a positive EMA crossover, with its support range lying around 660-680.
If this level is sustain , then We may see higher price in TATAMOTORS.
Thank you !!
Axiscades : Unstoppable Axiscades , Flying highAxiscades : Unstoppable Axiscades , Flying high.
(3 Months Time Frame.)
( Not a Buy / Sell Recommendation
Do your own due diligence ,Market is subject to risks, This is my own view and for learning only .)

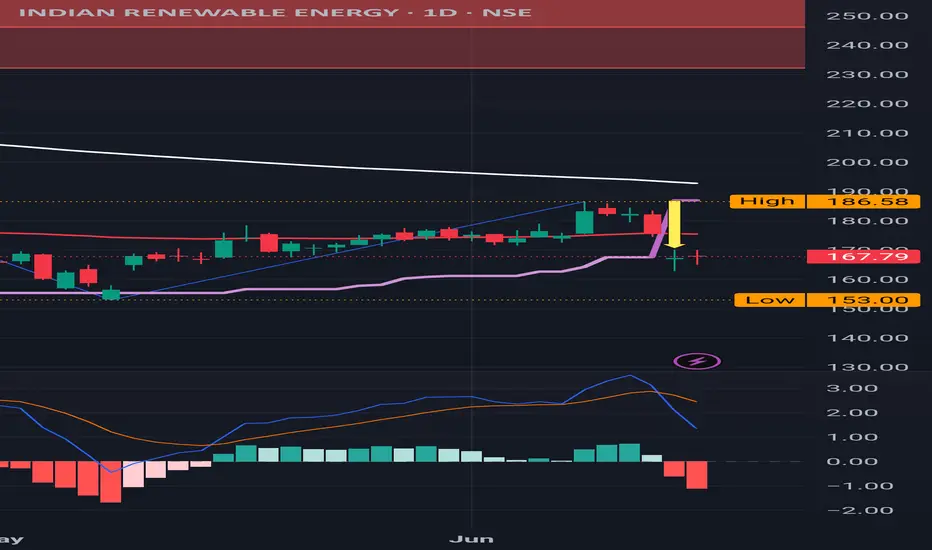
IREDA : Sell Triggered . Support 1 :160 , Support 2: 150
IREDA : Sell Triggered . Support 1 :160 , Support 2: 150
( Not a Buy / Sell Recommendation
Do your own due diligence ,Market is subject to risks, This is my own view and for learning only .)
FACT : Sitting at the Red Band resistance
FACT : Sitting at the Red Band Resistance
Got a pull back from 1112 which will be an important level to test moving forward..
( Not a Buy / Sell Recommendation
Do your own due diligence ,Market is subject to risks, This is my own view and for learning only .)

REL Power : Feeling the resistance , couldn't sustain above it REL Power : Feeling the resistance , couldn't sustain above it and got a pulled back
This is 3 months Time frame .
( Not a Buy / Sell Recommendation
Do your own due diligence ,Market is subject to risks, This is my own view and for learning only .)

Sigma Solve is about to give a breakout Sigma Solve is about to give a breakout on daily chart with strong fundamentals

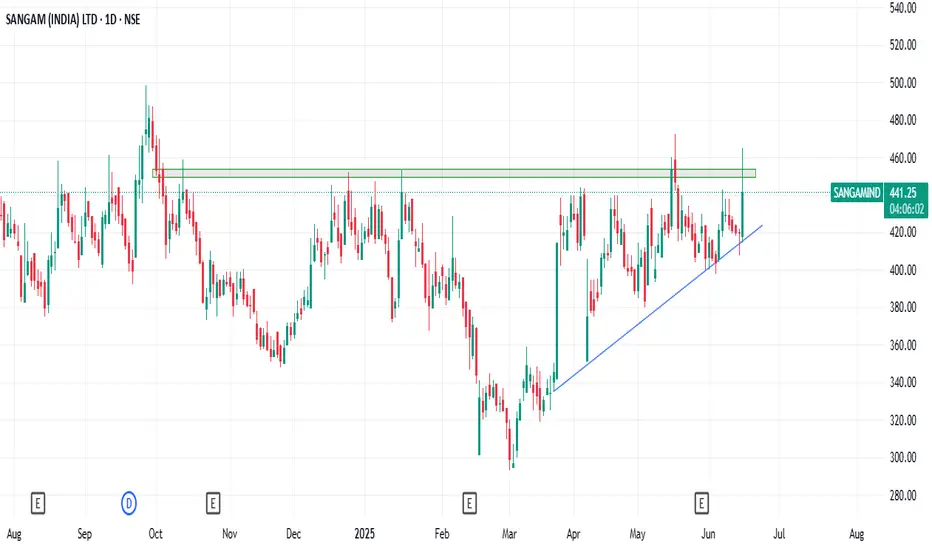
Sangam india is about give a breakoutSangam india is about give a breakout on daily chart wait for a breakout
CARYSIL- LOOKS GOOD.Here's a detailed technical analysis using Elliott Wave Theory (EWT), Fibonacci, and volume/RSI interpretation for CARYSIL LTD (Weekly Chart):
🔍 Chart Analysis Summary:
1. Trend & Structure
A falling trendline was broken decisively with strong bullish candles and high volume—indicating a trend reversal.
The recent structure indicates a potential Wave 3 rally if we consider the Elliott Wave framework from the bottom near ₹431.
🌀 Elliott Wave Analysis (Probable Count)
Wave 1: Approx ₹431 → ₹730 (early 2024)
Wave 2: Correction from ₹730 → ₹520 (shallow, possibly zig-zag or flat)
Wave 3: Now ongoing, from ₹520 → ₹917+ (current high).
Wave 3 typically shows impulsive strength, supported here by volume and breakout behavior.
Wave 4 & 5: Yet to unfold; Wave 4 may likely consolidate near ₹820–850 before a final push toward ₹1000+ (Wave 5).
📐 Fibonacci Levels
Assuming:
Wave 1 = 431 to 730 = 299 pts
Projecting Wave 3 = 1.618 × Wave 1 = ~483 pts
From Wave 2 low (₹520) → Wave 3 potential target = ₹520 + ₹483 = ₹1003 (nearly tested)
Key Levels:
61.8% retracement of full fall (approx ₹1150 → ₹431) = ~₹900–920 zone (now reached)
Golden Ratio resistance in play
If this level is cleanly surpassed, next targets using Fib Extension:
1.618 of Wave 1 = ₹1000–1020
2.618 = ₹1150 (next major resistance)
📊 Volume & RSI Analysis
Volume Surge: Confirms institutional buying interest on breakout.
RSI: Near 69 (overbought zone), but typical of Wave 3. Not a sell signal yet, but keep watch for divergence.
RSI-based MA: Still lagging around 51—showing momentum has only recently shifted strong.
✅ Suggestions
Short-Term:
Some resistance near ₹920–940 likely due to previous swing highs and Fib zone.
Expect mild pullback/consolidation (possible Wave 4) before Wave 5 targets.
Medium-Term:
Hold with SL below ₹840 (previous breakout zone).
Watch for price-volume confirmation on any move beyond ₹950.
Fibonacci Retracement for Support:
Key pullback support zones: ₹850 / ₹800 (0.382 / 0.5 retracement of Wave 3).
📚 Learnings / Takeaways
Trendline + volume breakout with impulsive candles is a reliable Wave 3 signal.
Fibonacci extensions + RSI give confluence levels for Wave 3 exhaustion.
Don’t pre-empt Wave 5 without letting Wave 4 structure complete.
RSI divergence is often seen between Wave 3 and 5 (watch for this in the future).

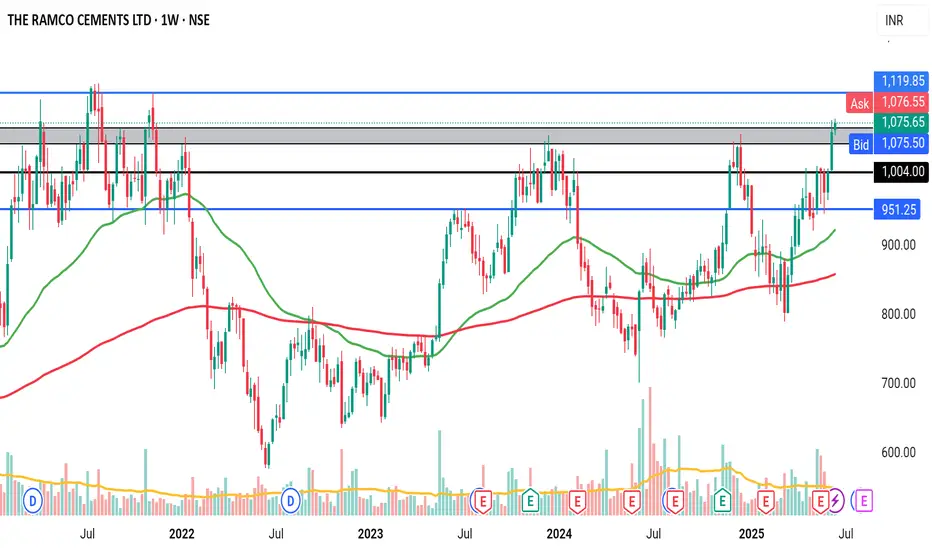
Bulls entering cementClear breakout, crossed 50EMA, crossed strong resistance with good volume and big green candle. Has potential to break ATH.
Buy the Dip: Tata Motors Set to Zoom from ₹713 to ₹799!Consider buying Tata Motors stock below ₹713 with a long-term target of ₹799, offering a potential profit of approximately 12%.

Bull divergence at lower level , means bulls for coming back.Here we are going for long in SBICARD through its running in all time high. it's showing bullishness. So, a long trade should be initiated here by seeing RSI indicator there it's running above 50 level means bullishness can be seen in this stock.
