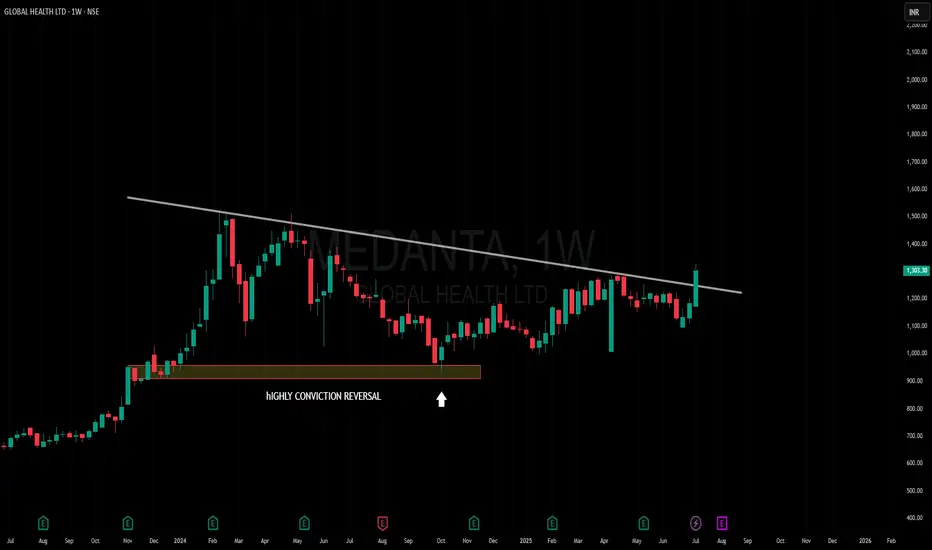
Amazing breakout on WEEKLY Timeframe - MEDANTACheckout an amazing breakout happened in the stock in Weekly timeframe, macroscopically seen in Daily timeframe. Having a great favor that the stock might be bullish expecting a staggering returns of minimum 25% TGT. IMPORTANT BREAKOUT LEVELS ARE ALWAYS RESPECTED!
NOTE for learners: Place the breakout levels as per the chart shared and track it yourself to get amazed!!
#No complicated chart patterns
#No big big indicators
#No Excel sheet or number magics
TRADE IDEA: WAIT FOR THE STOCK TO BREAKOUT IN WEEKLY TIMEFRAME ABOVE THIS LEVEL.
Checkout an amazing breakout happened in the stock in Weekly timeframe.
Breakouts happening in longer timeframe is way more powerful than the breakouts seen in Daily timeframe. You can blindly invest once the weekly candle closes above the breakout line and stay invested forever. Also these stocks breakouts are lifelong predictions, it means technically these breakouts happen giving more returns in the longer runs. Hence, even when the scrip makes a loss of 10% / 20% / 30% / 50%, the stock will regain and turn around. Once they again enter the same breakout level, they will flyyyyyyyyyyyy like a ROCKET if held in the portfolio in the longer run.
Time makes money, GREEDY & EGO will not make money.
Also, magically these breakouts tend to prove that the companies turn around and fundamentally becoming strong. Also the magic happens when more diversification is done in various sectors under various scripts with equal money invested in each N500 scripts.
The real deal is when to purchase and where to purchase the stock. That is where Breakout study comes into play.
Check this stock which has made an all time low and high chances that it makes a "V" shaped recovery.
> Taking support at last years support or breakout level
> High chances that it reverses from this point.
> Volume dried up badly in last few months / days.
> Very high suspicion based analysis and not based on chart patterns / candle patterns deeply.
> VALUABLE STOCK AVAILABLE AT A DISCOUNTED PRICE
> OPPURTUNITY TO ACCUMULATE ADEQUATE QUANTITY
> MARKET AFTER A CORRECTION / PANIC FALL TO MAKE GOOD INVESTMENT
DISCLAIMER : This is just for educational purpose. This type of analysis is equivalent to catching a falling knife. If you are a warrior, you throw all the knives back else you will be sorrow if it hits SL. Make sure to do your analysis well. This type of analysis only suits high risks investor and whose is willing to throw all the knives above irrespective of any sectoral rotation. BE VERY CAUTIOUS AS IT IS EXTREME BOTTOM FISHING.
HOWEVER, THIS IS HOW MULTIBAGGERS ARE CAUGHT !
STOCK IS AT RIGHT PE / RIGHT EVALUATION / MORE ROAD TO GROW / CORRECTED IV / EXCELLENT BOOKS / USING MARKET CRASH AS AN OPPURTUNITY / EPS AT SKY.
LET'S PUMP IN SOME MONEY AND REVOLUTIONIZE THE NATION'S ECONOMY!
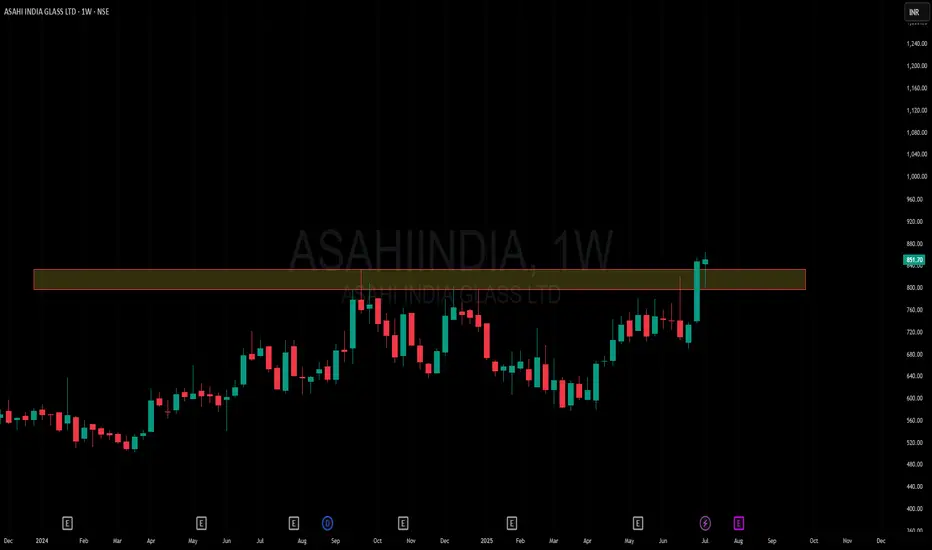
Amazing breakout on WEEKLY Timeframe - ASAHIINDIACheckout an amazing breakout happened in the stock in Weekly timeframe, macroscopically seen in Daily timeframe. Having a great favor that the stock might be bullish expecting a staggering returns of minimum 25% TGT. IMPORTANT BREAKOUT LEVELS ARE ALWAYS RESPECTED!
NOTE for learners: Place the breakout levels as per the chart shared and track it yourself to get amazed!!
#No complicated chart patterns
#No big big indicators
#No Excel sheet or number magics
TRADE IDEA: WAIT FOR THE STOCK TO BREAKOUT IN WEEKLY TIMEFRAME ABOVE THIS LEVEL.
Checkout an amazing breakout happened in the stock in Weekly timeframe.
Breakouts happening in longer timeframe is way more powerful than the breakouts seen in Daily timeframe. You can blindly invest once the weekly candle closes above the breakout line and stay invested forever. Also these stocks breakouts are lifelong predictions, it means technically these breakouts happen giving more returns in the longer runs. Hence, even when the scrip makes a loss of 10% / 20% / 30% / 50%, the stock will regain and turn around. Once they again enter the same breakout level, they will flyyyyyyyyyyyy like a ROCKET if held in the portfolio in the longer run.
Time makes money, GREEDY & EGO will not make money.
Also, magically these breakouts tend to prove that the companies turn around and fundamentally becoming strong. Also the magic happens when more diversification is done in various sectors under various scripts with equal money invested in each N500 scripts.
The real deal is when to purchase and where to purchase the stock. That is where Breakout study comes into play.
Check this stock which has made an all time low and high chances that it makes a "V" shaped recovery.
> Taking support at last years support or breakout level
> High chances that it reverses from this point.
> Volume dried up badly in last few months / days.
> Very high suspicion based analysis and not based on chart patterns / candle patterns deeply.
> VALUABLE STOCK AVAILABLE AT A DISCOUNTED PRICE
> OPPURTUNITY TO ACCUMULATE ADEQUATE QUANTITY
> MARKET AFTER A CORRECTION / PANIC FALL TO MAKE GOOD INVESTMENT
DISCLAIMER : This is just for educational purpose. This type of analysis is equivalent to catching a falling knife. If you are a warrior, you throw all the knives back else you will be sorrow if it hits SL. Make sure to do your analysis well. This type of analysis only suits high risks investor and whose is willing to throw all the knives above irrespective of any sectoral rotation. BE VERY CAUTIOUS AS IT IS EXTREME BOTTOM FISHING.
HOWEVER, THIS IS HOW MULTIBAGGERS ARE CAUGHT !
STOCK IS AT RIGHT PE / RIGHT EVALUATION / MORE ROAD TO GROW / CORRECTED IV / EXCELLENT BOOKS / USING MARKET CRASH AS AN OPPURTUNITY / EPS AT SKY.
LET'S PUMP IN SOME MONEY AND REVOLUTIONIZE THE NATION'S ECONOMY!
Will ITC go further down to 342 As per Harmonic PRZ pattern, if support level at 390 breaks, ITC can go further down to 362 and 342 in few weeks

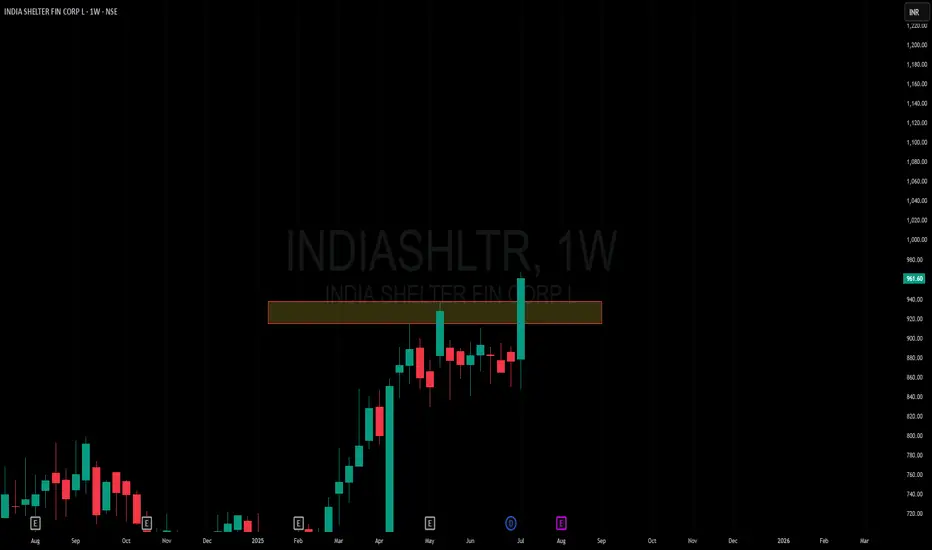
Amazing breakout on WEEKLY Timeframe - INDIASHLTRCheckout an amazing breakout happened in the stock in Weekly timeframe, macroscopically seen in Daily timeframe. Having a great favor that the stock might be bullish expecting a staggering returns of minimum 25% TGT. IMPORTANT BREAKOUT LEVELS ARE ALWAYS RESPECTED!
NOTE for learners: Place the breakout levels as per the chart shared and track it yourself to get amazed!!
#No complicated chart patterns
#No big big indicators
#No Excel sheet or number magics
TRADE IDEA: WAIT FOR THE STOCK TO BREAKOUT IN WEEKLY TIMEFRAME ABOVE THIS LEVEL.
Checkout an amazing breakout happened in the stock in Weekly timeframe.
Breakouts happening in longer timeframe is way more powerful than the breakouts seen in Daily timeframe. You can blindly invest once the weekly candle closes above the breakout line and stay invested forever. Also these stocks breakouts are lifelong predictions, it means technically these breakouts happen giving more returns in the longer runs. Hence, even when the scrip makes a loss of 10% / 20% / 30% / 50%, the stock will regain and turn around. Once they again enter the same breakout level, they will flyyyyyyyyyyyy like a ROCKET if held in the portfolio in the longer run.
Time makes money, GREEDY & EGO will not make money.
Also, magically these breakouts tend to prove that the companies turn around and fundamentally becoming strong. Also the magic happens when more diversification is done in various sectors under various scripts with equal money invested in each N500 scripts.
The real deal is when to purchase and where to purchase the stock. That is where Breakout study comes into play.
Check this stock which has made an all time low and high chances that it makes a "V" shaped recovery.
> Taking support at last years support or breakout level
> High chances that it reverses from this point.
> Volume dried up badly in last few months / days.
> Very high suspicion based analysis and not based on chart patterns / candle patterns deeply.
> VALUABLE STOCK AVAILABLE AT A DISCOUNTED PRICE
> OPPURTUNITY TO ACCUMULATE ADEQUATE QUANTITY
> MARKET AFTER A CORRECTION / PANIC FALL TO MAKE GOOD INVESTMENT
DISCLAIMER : This is just for educational purpose. This type of analysis is equivalent to catching a falling knife. If you are a warrior, you throw all the knives back else you will be sorrow if it hits SL. Make sure to do your analysis well. This type of analysis only suits high risks investor and whose is willing to throw all the knives above irrespective of any sectoral rotation. BE VERY CAUTIOUS AS IT IS EXTREME BOTTOM FISHING.
HOWEVER, THIS IS HOW MULTIBAGGERS ARE CAUGHT !
STOCK IS AT RIGHT PE / RIGHT EVALUATION / MORE ROAD TO GROW / CORRECTED IV / EXCELLENT BOOKS / USING MARKET CRASH AS AN OPPURTUNITY / EPS AT SKY.
LET'S PUMP IN SOME MONEY AND REVOLUTIONIZE THE NATION'S ECONOMY!
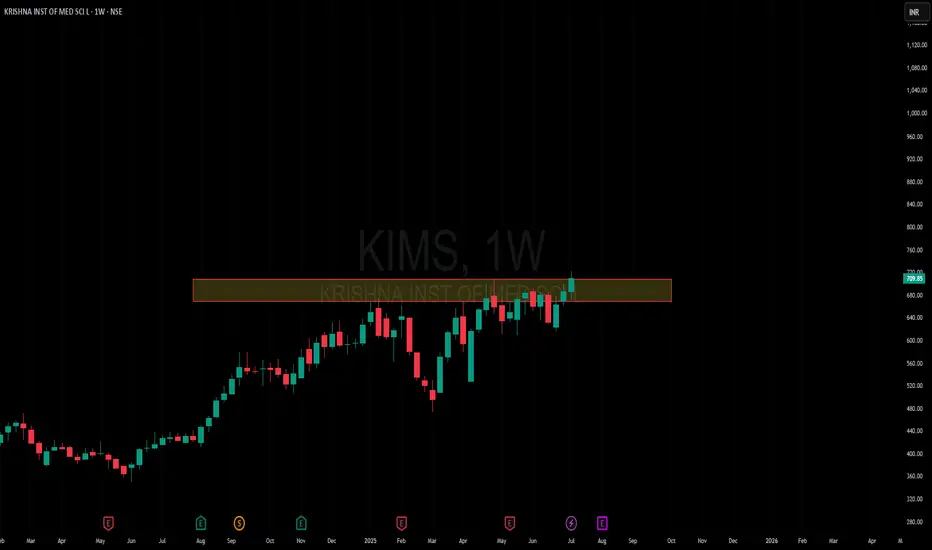
Amazing breakout on WEEKLY Timeframe - KIMSCheckout an amazing breakout happened in the stock in Weekly timeframe, macroscopically seen in Daily timeframe. Having a great favor that the stock might be bullish expecting a staggering returns of minimum 25% TGT. IMPORTANT BREAKOUT LEVELS ARE ALWAYS RESPECTED!
NOTE for learners: Place the breakout levels as per the chart shared and track it yourself to get amazed!!
#No complicated chart patterns
#No big big indicators
#No Excel sheet or number magics
TRADE IDEA: WAIT FOR THE STOCK TO BREAKOUT IN WEEKLY TIMEFRAME ABOVE THIS LEVEL.
Checkout an amazing breakout happened in the stock in Weekly timeframe.
Breakouts happening in longer timeframe is way more powerful than the breakouts seen in Daily timeframe. You can blindly invest once the weekly candle closes above the breakout line and stay invested forever. Also these stocks breakouts are lifelong predictions, it means technically these breakouts happen giving more returns in the longer runs. Hence, even when the scrip makes a loss of 10% / 20% / 30% / 50%, the stock will regain and turn around. Once they again enter the same breakout level, they will flyyyyyyyyyyyy like a ROCKET if held in the portfolio in the longer run.
Time makes money, GREEDY & EGO will not make money.
Also, magically these breakouts tend to prove that the companies turn around and fundamentally becoming strong. Also the magic happens when more diversification is done in various sectors under various scripts with equal money invested in each N500 scripts.
The real deal is when to purchase and where to purchase the stock. That is where Breakout study comes into play.
Check this stock which has made an all time low and high chances that it makes a "V" shaped recovery.
> Taking support at last years support or breakout level
> High chances that it reverses from this point.
> Volume dried up badly in last few months / days.
> Very high suspicion based analysis and not based on chart patterns / candle patterns deeply.
> VALUABLE STOCK AVAILABLE AT A DISCOUNTED PRICE
> OPPURTUNITY TO ACCUMULATE ADEQUATE QUANTITY
> MARKET AFTER A CORRECTION / PANIC FALL TO MAKE GOOD INVESTMENT
DISCLAIMER : This is just for educational purpose. This type of analysis is equivalent to catching a falling knife. If you are a warrior, you throw all the knives back else you will be sorrow if it hits SL. Make sure to do your analysis well. This type of analysis only suits high risks investor and whose is willing to throw all the knives above irrespective of any sectoral rotation. BE VERY CAUTIOUS AS IT IS EXTREME BOTTOM FISHING.
HOWEVER, THIS IS HOW MULTIBAGGERS ARE CAUGHT !
STOCK IS AT RIGHT PE / RIGHT EVALUATION / MORE ROAD TO GROW / CORRECTED IV / EXCELLENT BOOKS / USING MARKET CRASH AS AN OPPURTUNITY / EPS AT SKY.
LET'S PUMP IN SOME MONEY AND REVOLUTIONIZE THE NATION'S ECONOMY!
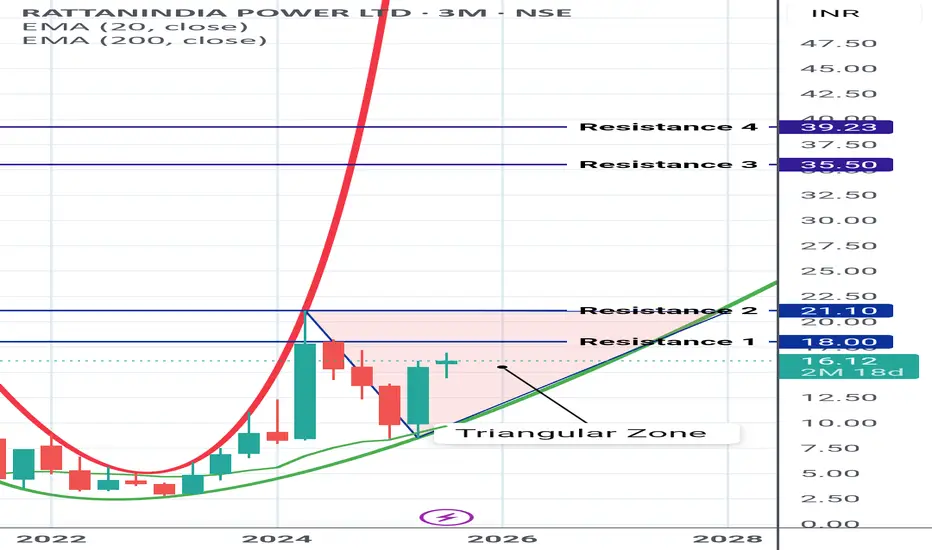
Rattan India Power (RTN POWER) RTN POWER having good power to cross the marked Triangular zone.
On closing above the triangular zone, the above marked horizontal lines will be the resistances
Shared it for Reference purpose based on chart pattern.
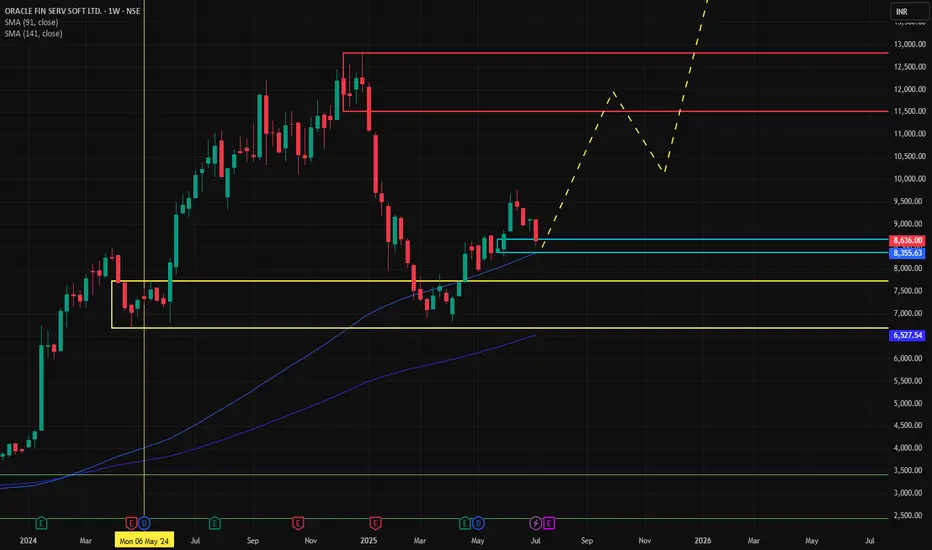
OFSS📈 Trade Plan (BUY Setup)
Parameter Value
Entry Price 8565
Stop Loss (SL) 8365
Risk 200 pts
Target (Reward) 10234 pts
Target Price 18799
Risk:Reward (RR) 51.2
🔎 Reference Points
Last High: 12809
Last Low: 6819
Point Variation: 5990
✅ Key Takeaways
All trend indicators point strongly bullish from long to short term.
Entry at 8565 with a tight SL of 8365 offers a very high Risk:Reward ratio of 51.2, indicating a strong asymmetric trade opportunity.
The target of 18799 is significantly above the current price, which might be aggressive—make sure this aligns with your trading timeframe and risk profile.
The entry is supported by multiple demand zones across MTF and ITF levels, particularly around the 8500–8600 range.
🔢 Gann Levels Summary (Key Psychological Zones)
Gann Level Value
Long Above 7562
Short Below 7300
🔍 Interpretation & Integration with MTF Trade Plan
Current Entry in Trade Plan:
Your buy entry is at 8565, well above the Gann long trigger of 7562.
This confirms the bullish continuation above the Gann breakout level — indicating you're entering in the confirmed strength zone.
Gann Short Trigger:
7300 is significantly below current levels and also below the last low (6819).
If price ever breaks below this, it invalidates the bullish structure and can signal a trend reversal.
Gann as Confirmation Tool:
Use Gann level of 7562 as a reconfirmation level — if price dips but remains above this, bulls are still in control.
A retest of the 7562 level can offer re-entry opportunities with tighter stop-loss for better risk management.
✅ Conclusion
Your buy trade at 8565 is well-aligned with all major MTF, demand zones, and above Gann bullish breakout level of 7562.
As long as price stays above 7562, you’re in a strong uptrend zone.
If price falls below 7300, watch for structural weakness or reversal cues.
🔍 MTF Analysis Summary
All timeframes (HTF, MTF, ITF) indicate a strong upward trend.
📊 High Time Frame (HTF) - Long-Term Trend
Period Trend Analysis Proximal Distal Avg
Yearly UP OFSS Yearly Demand 4253 4020 4,137
Half-Yearly UP OFSS 6-Month Demand - RALLY RALLY 9737 9036 9,387
Quarterly UP Breakout + Quarterly Demand 4253 3510 3,882
HTF Avg 6081 5522 5802
🗓️ Mid Time Frame (MTF) - Medium-Term Trend
Period Trend Analysis Proximal Distal Avg
Monthly UP Monthly Demand (DMIP) 7736 6804 7,270
Weekly UP Weekly Demand (DMIP) 8661 8365 8,513
Daily UP Daily Demand (BUFL) 8590 8267 8,429
MTF Avg 8329 7812 8071
🕒 Intraday Time Frame (ITF) - Short-Term Trend
Period Trend Analysis Proximal Distal Avg
240 Min UP Demand Zone (DMIP) 8470 8267 8,369
180 Min UP Demand Zone (DMIP) 8491 8267 8,379
60 Min UP Demand Zone (DMIP) 8565 8544 8,555
ITF Avg 8509 8359 8434
Emami Ltd looking promising Emami Ltd retested multi year breakout. Keep monthly SL of 560 to ride the trend.

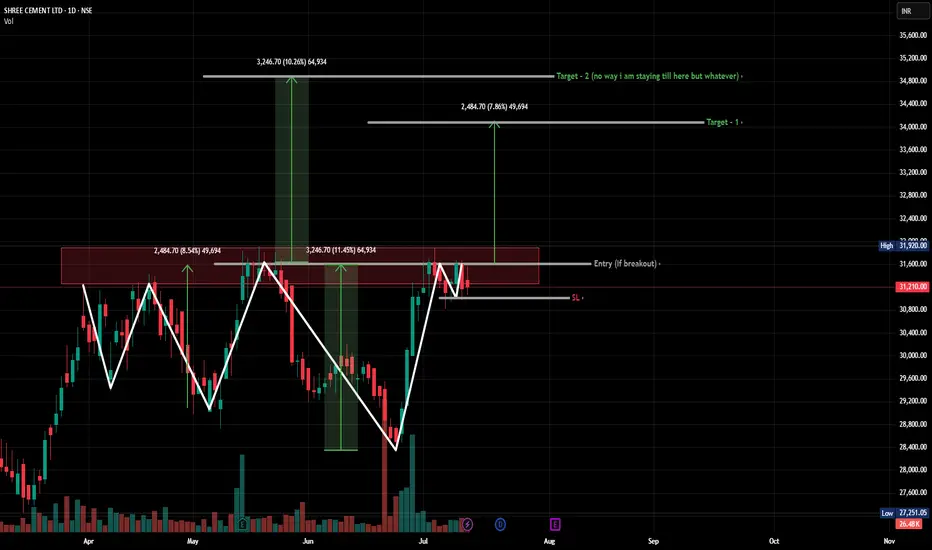
Invert Head and shoulder + cup with handle + 2x Double bottomOkay so I tried naming this pattern but gave up halfway because:
There’s a clean Inverted Head & Shoulders
A perfectly awkward Cup with Handle
And not one but two Double Bottoms, stacked like technical lasagna
All that drama right under the same resistance zone
👹 The red rectangle? It’s been tested five times already. FIVE.
If this level breaks, it won’t just be a breakout — it’ll be a ritual summoning. A support level forged in volume, trauma, and the unholy power of pattern layering.
If it flips, this zone is gonna be support backed by every TA demon in the book.
BF UTILITIES LTD 'S KEY LEVEL || BREAKDOWN OR BREAKOUT ??These are two charts of BF Utilities – one on the daily timeframe and the other on the weekly timeframe.
In the first chart : BF Utilities is sustaining near its Law of Polarity (LOP), which is acting as a resistance zone around the 880–890 range.
In the second chart : BF Utilities is forming a Rising Wedge pattern, with the resistance also lying in the 870–880 zone.
If this level is sustain ,then we may see lower price in BF Utilities.If this level is broken, the stock may move towards the upper boundary of the channel.
Thank you !!

SWING IDEA - NEULAND LABNeuland Lab , a niche API manufacturer with strong export presence and leadership in complex molecules, is offering a technically strong swing trade opportunity from key support levels.
Reasons are listed below :
11,500 zone acting as a crucial support area
Formation of a hammer candle on the weekly timeframe, signaling potential reversal
Reversing from the 0.618 Fibonacci retracement zone – the golden pocket
Taking support at the 50-week EMA , holding long-term trend structure
Target - 14900 // 17600
Stoploss - weekly close below 10215
DISCLAIMER -
Decisions to buy, sell, hold or trade in securities, commodities and other investments involve risk and are best made based on the advice of qualified financial professionals. Any trading in securities or other investments involves a risk of substantial losses. The practice of "Day Trading" involves particularly high risks and can cause you to lose substantial sums of money. Before undertaking any trading program, you should consult a qualified financial professional. Please consider carefully whether such trading is suitable for you in light of your financial condition and ability to bear financial risks. Under no circumstances shall we be liable for any loss or damage you or anyone else incurs as a result of any trading or investment activity that you or anyone else engages in based on any information or material you receive through TradingView or our services.
@visionary.growth.insights

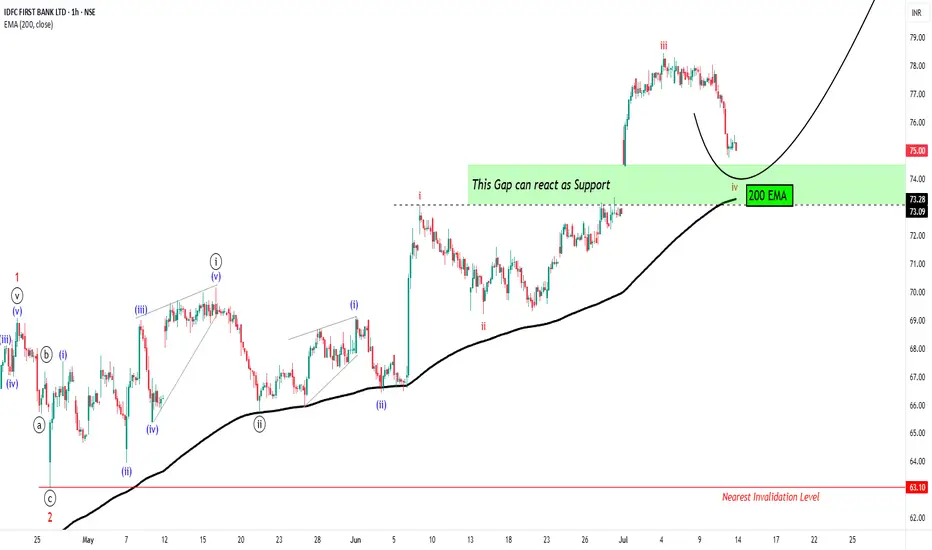
Potential Reversal Ahead: Elliott Wave AnalysisHello friends,
Welcome to RK_Chaarts,
Today we're going to analyze chart of stock named IDFC First Bank, based on Elliott wave theory.
Today, we're analyzing the chart of IDFC First Bank using Elliott Wave theory. On the chart, we've marked the Elliott Waves, indicating that:
- Red wave 1 and 2 (Minor degree) have ended
- Price is unfolding into red wave 3 (Minor degree)
- Black wave ((i)) and ((ii)) (Minute degree) have completed
- Black wave ((iii)) (Minute degree) is ongoing
- Blue wave (i) and (ii) (Minuette degree) have finished
- Blue wave (iii) (Minuette degree) is in progress
- Red wave i, ii, and iii (Subminuette degree) have completed
- Possibly in the correction phase of red wave iv (Subminuette degree)
We observe that the price gapped up, retraced to correct wave iv, and is now supported by the gap zone. Along with 200Exponential Moving Average is also at Gap level which can also provide a good Support to same view.
Our estimate suggests a high probability of a price reversal. However, market uncertainties exist.
Potential price targets: 81, 93, and 100+
Nearest invalidation level: 73.09 (wave iv should not overlap wave i)
Please note that this analysis is for educational purposes only. I'm not a SEBI-registered analyst, and you should consult your financial advisor before trading or investing.
Let's see how the market unfolds. This entire study is shared solely for educational purposes. Thank you so much.
I am not Sebi registered analyst.
My studies are for educational purpose only.
Please Consult your financial advisor before trading or investing.
I am not responsible for any kinds of your profits and your losses.
Most investors treat trading as a hobby because they have a full-time job doing something else.
However, If you treat trading like a business, it will pay you like a business.
If you treat like a hobby, hobbies don't pay, they cost you...!
Hope this post is helpful to community
Thanks
RK💕
Disclaimer and Risk Warning.
The analysis and discussion provided on in.tradingview.com is intended for educational purposes only and should not be relied upon for trading decisions. RK_Chaarts is not an investment adviser and the information provided here should not be taken as professional investment advice. Before buying or selling any investments, securities, or precious metals, it is recommended that you conduct your own due diligence. RK_Chaarts does not share in your profits and will not take responsibility for any losses you may incur. So Please Consult your financial advisor before trading or investing.
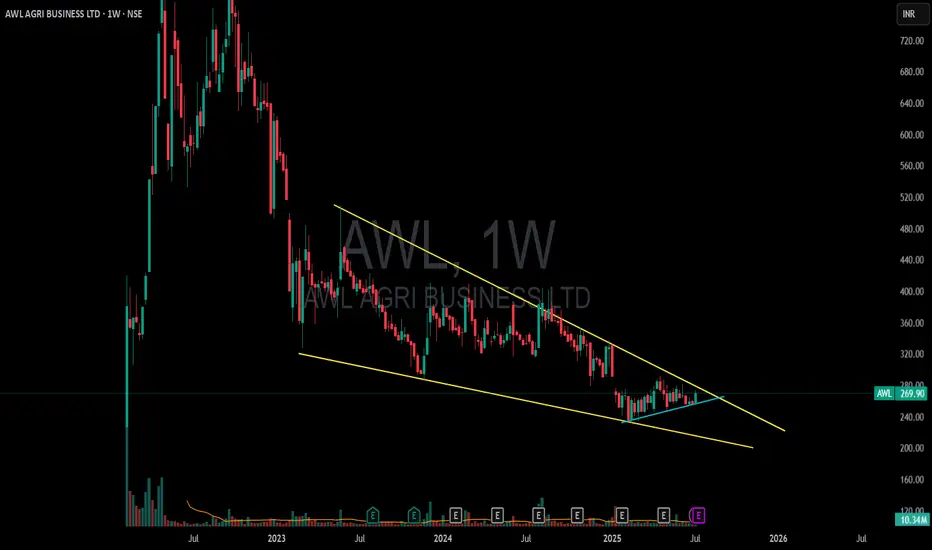
AWL 1W📊 Financial Performance Highlights
Q2 FY25 (H1 2024–25)
Revenue: ₹14,460 cr (+18% YoY)
Net profit: ₹311 cr vs. prior-year loss of ₹131 cr
H1 Operating EBITDA: ₹1,232 cr (+349% YoY); PAT ₹624 cr
Concall Analysis - read conference calls
+5
Angel One
+5
ICICI Direct
+5
Q3 FY25 (Quarter ended Dec 2024)
Revenue: ₹16,859 cr (+31% YoY)
PAT: ₹411 cr (+105% YoY); EBITDA ₹792 cr (+57% YoY)
Moneycontrol
+2
Business Today
+2
Concall Analysis - read conference calls
+2
Key growth drivers:
Edible oils: Volume +4–6% YoY; Rev. +38–39%
Foods & FMCG: Volume +22–23%, Rev. +22–34%
E‑commerce/QC channels surged ~41%
Reddit
+12
Business Today
+12
ICICI Direct
+12
Business Today
+3
Moneycontrol
+3
ICICI Direct
+3
Q4 FY25 (Quarter ended Mar 2025)
Volume growth: +7% YoY across businesses
FY revenue: ~₹62,000 cr (+26% YoY)
Foods & FMCG segment reached ~₹6,150–6,273 cr for FY + strong rural expansion
Rebranding to AWL Agri Business effective March 17, 2025
Business Today
+2
Business Standard
+2
HospiBuz
+2
HospiBuz
🌍 Strategic & Operational Drivers
Rural expansion: From ~5K towns in 2022 to >43K by Dec 2024; aimed >50K by FY25
Business Standard
+4
Angel One
+4
Business Today
+4
Diversification: Rising share from foods & FMCG (~11–44% of revenues depending on metrics), personal care, and industrial products
Wikipedia
+7
Reddit
+7
Business Today
+7
E-commerce push: QC platforms (Blinkit, Zepto) and HORECA segment scaling up
Angel One
+2
Reuters
+2
Business Standard
+2
Commodity tailwinds: Benefits from edible oil price cycles have improved margins
ICICI Direct
+11
Concall Analysis - read conference calls
+11
Business Standard
+11
Corporate cleanup: Exit from Adani Group post-US legal noise; simplifies ownership & governance
Business Today
+3
Financial Times
+3
Reuters
+3
⚖️ Strengths vs. Risks
Strengths Risks / Challenges
Market leader in edible oils Commodity price volatility
Rapid rural & e‑com expansion Competitive, low-margin category
Diversified revenue base Reputational overhang from Adani exit
Strong financial rebound post-loss Execution risks in new ventures
Global JV benefits ESG concerns—deforestation & labor
Moneycontrol
Angel One
+2
Reuters
+2
Concall Analysis - read conference calls
+2
Financial Times
Adani Wilmar
Wikipedia
🧭 Outlook & Analyst Sentiment
Management is guiding for ~10% volume growth next year, with edible oils +6% and >20% food/FMCG growth
Reuters
+1
Business Standard
+1
Nuvama projects ~64% upside based on execution; emphasizes long‑term potential in foods/FMCG category
Business Today
Analysts view the exit from Adani as a de-risking, enabling sharper focus and better valuation transparency
✅ Summary
AWL Agri Business (ex-Adani Wilmar) stands as a formidable FMCG player with robust top-line growth (20–30% YoY), strong profitability, and ambitious rural and e-commerce expansion. While commodity swings and reputational risks remain, the company has successfully pivoted toward branded foods, diversified its portfolio, and streamlined corporate structure.
Disclaimer: The information provided is for educational and informational purposes only and should not be considered as financial advice. Investing in the stock market involves risk, and past performance is not indicative of future results. Please consult with a certified financial advisor or conduct your own research before making any investment decisions. We are not responsible for any losses incurred as a result of using this information. Stock market investments are subject to market risks; read all related documents carefully.
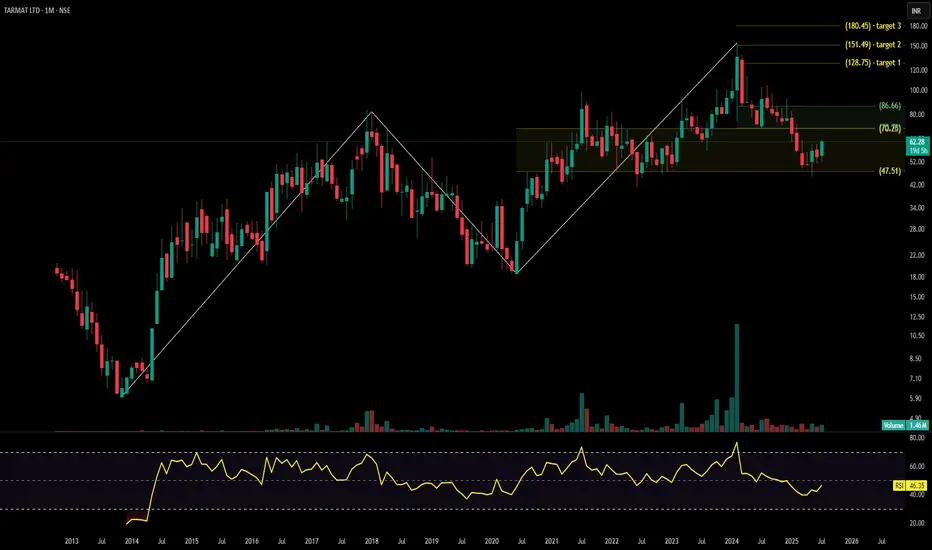
TARMAT LTDTarmat Ltd. is a mid-cap infrastructure development company specializing in engineering, procurement, and construction (EPC) of roads, highways, bridges, and airports. Operating across multiple Indian states, it works with government agencies and defense sector clients. The stock is currently trading at ₹62.28, showing signs of base formation with volume expansion and a well-defined Fibonacci breakout structure.
Tarmat Ltd. – FY22–FY25 Snapshot
Sales – ₹150 Cr → ₹178 Cr → ₹195 Cr → ₹215 Cr – Gradual revenue growth with stable order execution
Net Profit – ₹6.2 Cr → ₹7.5 Cr → ₹9.0 Cr → ₹10.6 Cr – Margin visibility improving with better project mix Company Order Book – Moderate → Moderate → Strong → Strong – Increasing inflow from central and state contracts Dividend Yield (%) – 0.00% → 0.00% → 0.00% → 0.00% – No payouts, reinvestment-focused approach
Operating Performance – Weak → Moderate → Moderate → Moderate – Cost efficiency gains visible
Equity Capital – ₹15.52 Cr (constant) – Stable ownership structure
Total Debt – ₹42 Cr → ₹40 Cr → ₹37 Cr → ₹34 Cr – Deleveraging in progress Total Liabilities – ₹89 Cr → ₹96 Cr → ₹103 Cr → ₹109 Cr – Aligned with order book expansion
Fixed Assets – ₹33 Cr → ₹35 Cr → ₹38 Cr → ₹41 Cr – Controlled capex, capacity-based investments
Latest Highlights FY25 net profit rose 17.7% YoY to ₹10.6 Cr; revenue increased 10.3% to ₹215 Cr EPS: ₹6.83 | EBITDA Margin: 14.6% | Net Margin: 4.93% Return on Equity: 13.52% | Return on Assets: 7.64% Promoter holding: 55.18% | Dividend Yield: 0.00% Recent order wins in Maharashtra, Karnataka, and airport runway expansion projects Improved cost controls and execution pace supporting profit momentum
Institutional Interest & Ownership Trends Promoter holding has remained stable at 55.18%, showing confidence in long-term strategy. Institutional interest is picking up post Q4 FY25 results, with DIIs adding 0.8% stake in April 2025. No signs of dilution or pledging activity observed. Overall ownership structure remains lean, and recent delivery volumes suggest selective accumulation by mid-cap trackers.
Business Growth Verdict Yes, Tarmat is showing promising signs of infrastructure-driven growth Margins and asset turnover improving steadily Debt profile is conservative and manageable Capex strategy is paced with execution capabilities
Company Guidance Management expects moderate revenue growth in FY26 with stable margins, supported by a healthy project pipeline. No major capex planned beyond routine equipment upgrades.
Final Investment Verdict Tarmat Ltd. offers a value-focused opportunity in India’s infra build-out cycle. The company’s small but stable base, growing order book, and improving margins suggest credible bottom-line visibility. While topline growth remains moderate and dividend payouts are absent, the low equity dilution, rising contract inflow, and renewed institutional interest make it an attractive candidate for staggered accumulation by investors seeking infra exposure in the mid-cap segment.

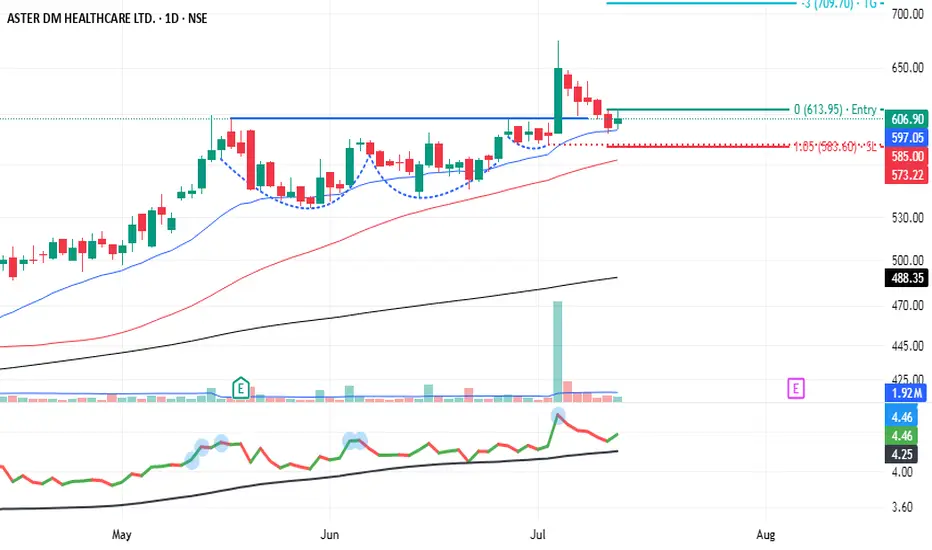
ASTERDM - classic VCP retest - My Pick - No AdviceASTERDM exhibited 3 shrinking pullbacks on its daily with increasingly narrow ranges and diminishing volume followed by a strong upside break. Post-breakout, the ideal setup is a retest: price pulls back to the breakout level (pivot), holding above it.
Fundamentally, Aster DM is a solid healthcare growth story: strong expansion, low debt, cash-rich, with robust ROCE/ROE. But valuation is rich, and earnings are skewed by non-core income.
Technically, VCP setup looks promising—good base, breakout, and retest in place.
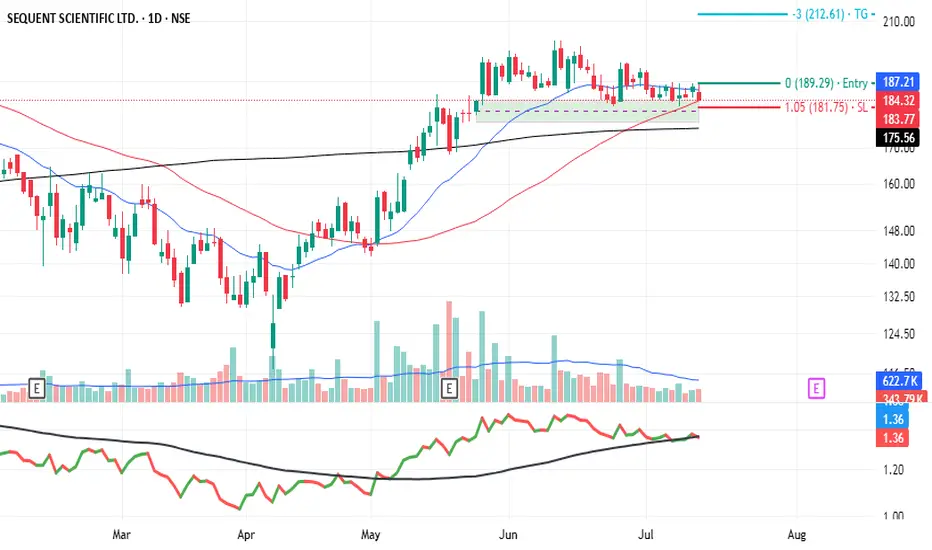
Sequent - My pick - No AdviceStrong Rally followed by period of consolidation with squeeze in volumes showing lack of selling pressure. Stock is resting at support level. if price drops below 180, could trigger stronger selling. A long-term investor may wait for a better entry near intrinsic value 155–160. Conversely and upside break could tigger a fresh rally. Business fundamentals show growth in revenue & profit, but high valuation leaves little room for error.
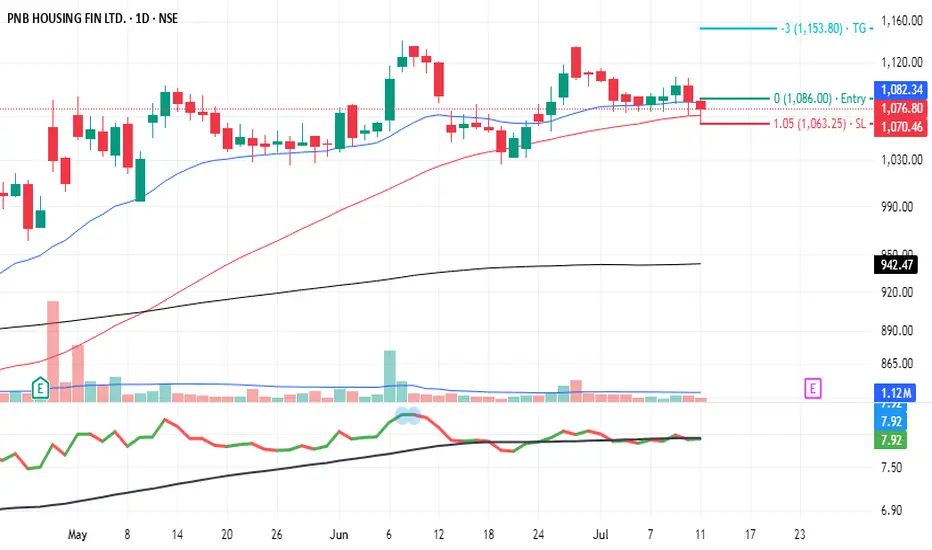
PNB Housing Finance - My Pick - No advice.Robust fundamentals indicate solid upside potential. If you believe in growth in the housing finance space, this could represent a strategic buy with a medium‑term horizon. Stock undercut 50 Day moving average and closed above it. it also undercut last several days low and close above it, showing lack of selling interest. A good close with good volume above PDH will tiggger my entry. These are my views and no advice to buy.
Importance of ATR(Average True Range)So idea here is to calculate risk.
understanding fear in the market ATR is an indication of volatility , not direction.
A smaller ATR range means low volatility.. tentatively market is consolidating.
A larger ATR range means the market is dealing with uncertainty so volatility has increased.
you can see the value of ATR on your chart.
the value of past ATR14period value is be greater than current ATR14 Period to take risk on a trades. it will help you reduce risk.

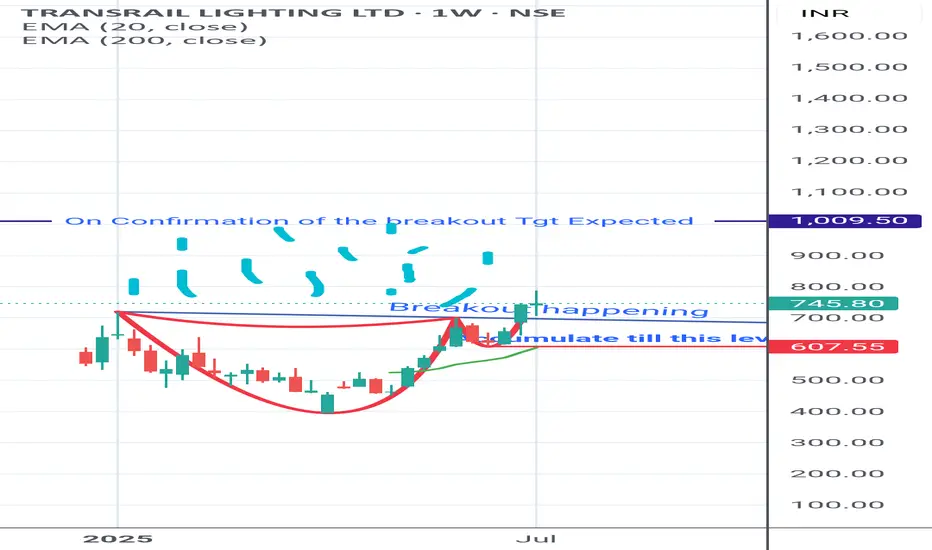
Transrail Lighting with beautiful Cup and handle pattern Have a SIP in this Cup of coffee. Looks good for Short /Longterm.
Enjoy it
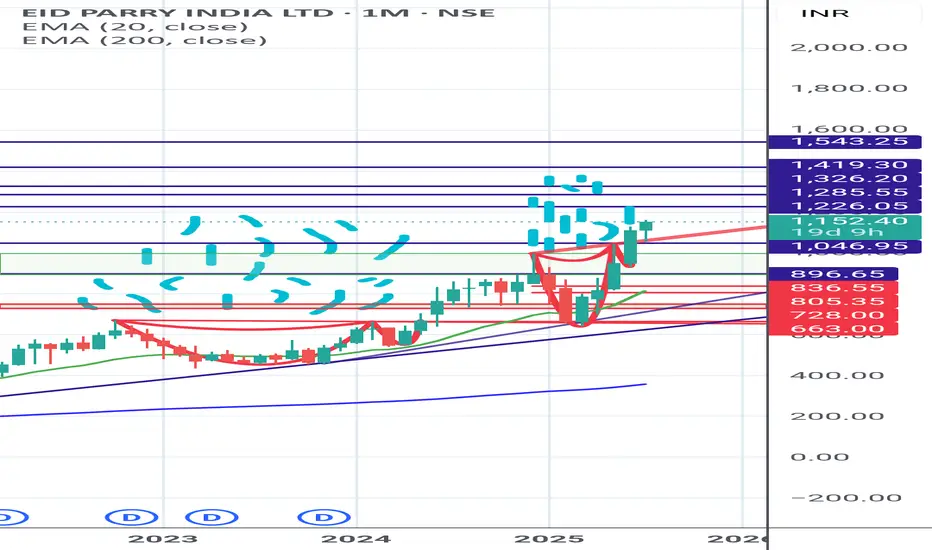
EID PARRY - TASTE THE 2ND CUP OF COFFEE Second Cup and handle pattern is ready. Taste the sweetness of it.
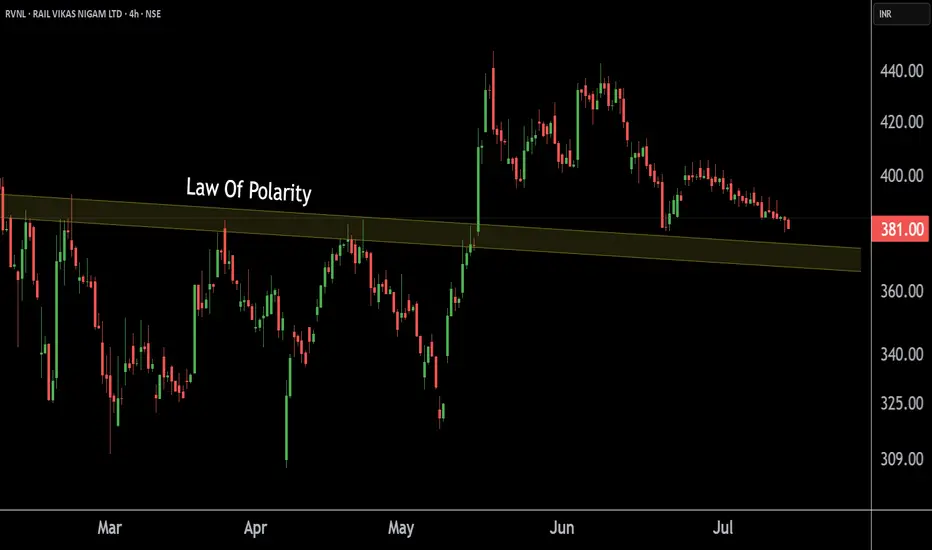
Rail Vikas Nigam's Key Level ! RVNL respecting its Support levelThis is the 4 hour timeframe chart of Rail Vikas Nigam Ltd.
RVNL having a Good law of polarity near at 365-370 level.
If this level is sustain ,then we may see higher prices in RVNL.
Thank You.
Jagsonpal pharma. Breakout doneExcellent breakout and now will retract a little before further rally towards target.
