ITC🔷 ITC Trade Setup Summary
Key Element Details
Trade Type BUY (Long)
Entry Price ₹416
Stop Loss ₹380
Target Price ₹604
Risk ₹36
Reward ₹188
Risk-Reward 5.2 : 1
Last High ₹498
Last Low ₹392
✅ Trade is trend-aligned across all timeframes.
📌 Entry at ₹416 is at the top of a demand cluster (monthly to intraday) – ideal for breakout continuation.
🔷 Setup Logic
✅ All trends UP: From Yearly down to 60 min – strong alignment.
📈 Entry sits just above a dense demand cluster (₹380–₹416) – smart and safe.
🛡️ Stop Loss (₹380) is protected by all demand zones.
🎯 Target (₹604) is realistic long-term, breaking past the previous high of ₹498.
🔷 Strategy Recap
Action Price Reason
BUY ₹416 Breakout above demand zones (DMIP)
SL ₹380 Below demand cluster (safe risk)
Target ₹604 Swing target, above previous high
🔷 Verdict
✅ Good RR (5.2:1) — even a 30–40% move to target gives excellent profit.
✅ Ideal for swing or positional traders.
⚠️ Watch for price consolidation around ₹416–₹420 before breakout.
🔷 Multi-Timeframe Demand Zone Breakdown
Timeframe Zone Type Zone Range (₹) Avg Price Remarks
Yearly BUFL 340 – 307 324 Strong long-term demand base
Half-Yearly BUFL 340 – 307 324 Matches yearly zone
Quarterly BUFL 372 – 357 365 Consolidation before breakout
Monthly DMIP 416 – 380 398 Entry sits on top of this zone
Weekly DMIP + Swap 416 – 380 398 Strong structure at entry area
Daily DMIP 402 – 380 391 Repeated buying interest
Intraday DMIP 407 – 394 401 Confirming strong near-term demand

POWER GRID🔹 Trade Setup Summary
Trade Type: Buy (Long)
Entry: ₹278
Stop Loss (SL): ₹258
Target: ₹485
Risk: ₹20
Reward: ₹207
Risk-Reward Ratio (RR): 10.4:1
Last High: ₹366
Last Low: ₹247
✅ All timeframes are UPTREND
✅ Entry at ₹278 is inside strong demand zones
✅ SL ₹258 is well protected by zone boundaries
✅ Target ₹485 is ambitious but realistic in trend continuation
🔹 Why This Trade Works
📊 All trends are UP – from yearly to 60-min.
💪 Strong support between ₹277–278, where price is likely to bounce.
🎯 Target is above previous high (₹366) – next leg of uptrend.
🛡️ Risk is limited (₹20) with a very high reward potential (₹207).
🔹 Clear Strategy
Action Price Reason
Buy ₹278 Inside monthly/weekly/daily demand zone
Stop Loss ₹258 Below all key demand zones
Target ₹485 Swing target based on trend & breakout
🔹 Zone Analysis (Multi-Timeframe Demand Zones)
Timeframe Zone (Proximal – Distal) Zone Avg Remarks
Yearly 240 – 153 197 Strong long-term base
Half-Yearly 240 – 226 233 Long-term support
Quarterly 298 – 226 262 Deep demand, includes entry
Monthly 299 – 257 278 Entry matches exact average
Weekly 278 – 258 268 Entry + SL inside this zone
Daily 285 – 277 281 Strong recent demand
Intraday 285 – 277 281 Multiple overlaps here

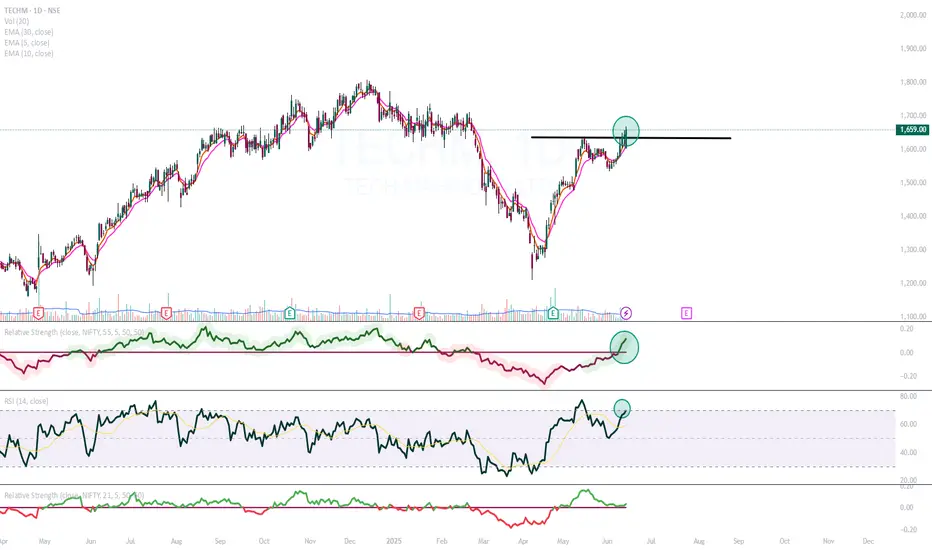
TECHM Looks interestingIT sector is doing relatively well.
Techm from the IT sector particularly looking very interesting.
RS is positive
RSI above 60
Break out with good volume
Potential Cup and Breakout in Jubilant Ingrevia 1. Volume Breakout
2. Possible Cup and Handle Breakout on Monthly timeframe
3. MACD signal getting positive
4. RSI above 50

Review and plan for 16th June 2025Nifty future and banknifty future analysis and intraday plan.
This video is for information/education purpose only. you are 100% responsible for any actions you take by reading/viewing this post.
please consult your financial advisor before taking any action.
----Vinaykumar hiremath, CMT

GRSE_LongPrice takes support at 20 DEMA with decent volume
Enter long if the hourly looks favorable with tight SL.
Target: 3400 & Previous High

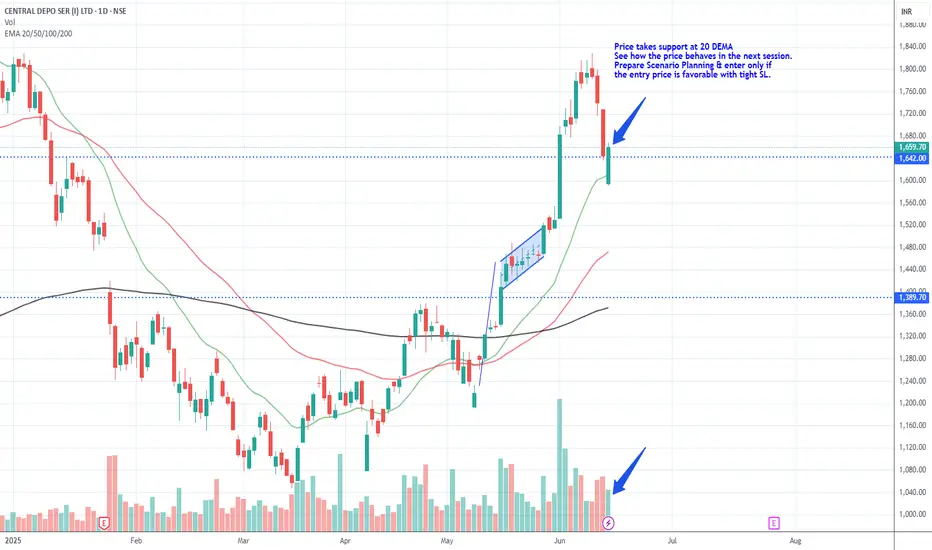
CDSL_Potential Re-entry pointPrice takes support at 20 DEMA
See how the price behaves in the next session.
Prepare Scenario Planning & enter only if
the entry price is favorable with tight SL.


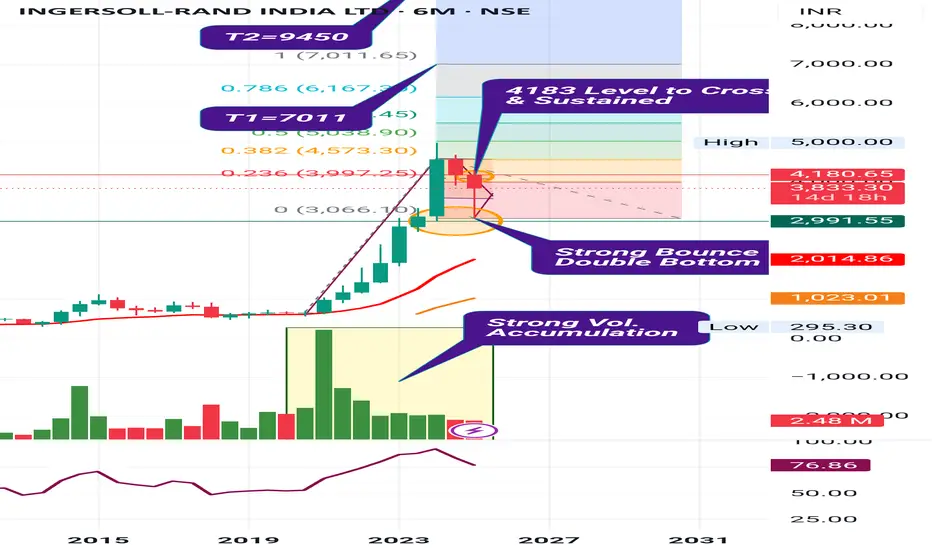
Ingersoll Rand India Ltd.*Ingersoll Rand India Ltd.*
P&F; Formation on Semi-Decadal Basis.
Double Bottom Bounce up on Yearly Basis.
Rising W on Weekly Basis.
Continued Traction of Vol. to be watched
RSI: 1H M. All in Bullish Zone.
EMAs: Widening Gaps amongst 20 50 100 200 levels at Monthly Basis.
*Trail SL with Upside*
*Book Profit as per Risk Appetite*
Improving Financials. Rising Revenue on Yrly basis. Improving TNW, Negligible Debt. Good Turnover/FA ratio. Good WC Cycle. +ve CF from Ops. Constant Promoter Stake. Oscillating FII / Increasing DII Stake. Low Float.
Concerns:
Conting. Liability of Rs.118 Crs.
*This is an Opinion. Do your own research as well.*
*_Happy Investing_*🤓
GMBREW ANALAYSIS LONG TERMThanks for stopping by.
All analysis here is done strictly from an investor’s perspective — focusing on risk, return, valuation, and potential upside.
The notes cover key details. I’ve backed every thesis with my own analysis — no fluff, just what matters to investors.
If you find the idea useful or have suggestions, feel free to leave a comment. Always open to fresh insights.
Kind regards,
Psycho Trader

APOLLO HOSPITALS: Symmetrical Triangle Breakout WatchApollo Hospitals (APOLLOHOSP) is currently forming a well-defined Symmetrical Triangle pattern on the daily chart.
Key Observations:
• Symmetrical Triangle: Price action has been consolidating within converging trendlines,
indicating indecision between buyers and sellers.
• Potential Breakout: A breakout above the upper trendline of the triangle, coupled with
increased volume, would signal a bullish continuation.
• Target 1 (Post-Breakout): The chart indicates a "Target 1 - for Positive Breakout" around
the 7300-7350 zone, which aligns with previous resistance levels.
• All-Time High Price Zone: The stock previously reached an "All Time High Price Zone"
around 7500-7600, which could be a further upside target if the bullish momentum
sustains.
Trading Idea:
• Entry: Look for a sustained breakout above the upper trendline of the symmetrical triangle. Confirm with strong volume.
• Target 1: 7300 - 7350 (Based on previous resistance and indicated target).
• Stop Loss: A break below the lower trendline of the symmetrical triangle would
invalidate the bullish setup. Traders can place stop-loss orders below a recent swing low
within the triangle or slightly below the lower trendline post-breakout confirmation.
Risk Management:
• Always use appropriate risk management and position sizing.
• Monitor volume closely during the breakout attempt.
Disclaimer : This is for educational purposes only and not financial advice. Do your own research before making any trading decisions.

CAMS – Rounding Bottom Breakout | Momentum PlayStructure:
CAMS has completed a classic rounding bottom formation over the past three months, with the neckline placed around ₹4,200. Price action from the March 2025 lows (~₹3,100) has remained within a well-defined ascending channel, signaling steady accumulation and controlled institutional entry.
On June 5, 2025, the stock gave a clean breakout above ₹4,200 with a strong bullish candle, closing at ₹4,248.30. Importantly, the move came with a volume of 877.56K, significantly higher than the 20-day average (576K), validating the breakout strength.
Momentum indicators are supportive — RSI has now crossed 70, confirming entry into bullish momentum territory without showing divergence or exhaustion yet.
Breakout Snapshot:
Pattern: Rounding Bottom + Ascending Channel
Breakout Level: ₹4,200
Entry: ₹4,248.30 (EOD Jun 5, 2025)
Volume: 877.56K vs 20-SMA 576K
RSI: 70.11 → strong bullish confirmation
🎯 Target: ₹5,120
📉 Stop-Loss: ₹4,000 (below breakout and channel support)
📈 Potential Upside: ~20%
⚖️ Risk-Reward: ~3.6x
Why It Matters:
CAMS has historically respected multi-month consolidations and offers clean post-breakout runs when supported by volume. This setup reflects a transition from accumulation to trend. The ascending structure indicates that smart money entered gradually — now validated with the breakout and volume spike.
Not a call to chase — idea is based on price-volume confirmation after a long base formation. Ideal entries are either near breakout (done) or on retest toward ₹4,180–₹4,200.
Track These:
₹4,400: Minor resistance
₹5,120: Measured move target
₹4,000: Invalidation zone
RSI > 75: Overheat caution
Disclaimer:
This analysis is for educational and informational purposes only. It does not constitute investment advice or a recommendation to buy or sell any security. Please consult your financial advisor before making any trading decisions.

ICRA📌 Trade Setup Summary
Parameter Value
Trade Type Positional BUY
Entry ₹6,570
Stop Loss ₹6,051
Risk ₹519
Target ₹10,455
Reward ₹3,885
Risk:Reward 7.5x
Last High ₹7,735
Last Low ₹5,015
✅ Why This Trade Works
🔹 Strong Multi-Timeframe Confluence: Entry lies in Weekly + Daily demand zone.
🔹 Fresh Institutional Demand at ₹6,051–₹6,570 (aligned across MTF and ITF).
🔹 Quarterly Breakout aligns with prior HTF zone, confirming momentum.
🔹 Aggressive R:R Ratio of 7.5x makes this a high reward trade with limited risk.
🔹 Breakout Retest Structure: Price action suggests demand revisit post breakout – ideal accumulation zone.
⚙️ Execution Plan
Entry Trigger: Between ₹6,520–₹6,570 with volume confirmation.
SL Below: ₹6,050 (just under daily/weekly demand zone).
Initial Target: ₹7,735 (Previous High).
Final Target: ₹10,455 (Extension projection).
SL Trailing: Start trailing post ₹7,400 for capital protection.
🚨 Risk Control & Entry Filter
Avoid entering on a gap-up candle >2%.
Watch for tight consolidation between ₹6,450–₹6,570.
Exit immediately if price breaks and sustains below ₹6,000 on high volume.
🏁 Conclusion
ICRA offers a premium high-conviction long opportunity with trend confirmation across all major timeframes, a low-risk entry near MTF + ITF demand clusters, and a clean 7.5:1 risk-reward setup. Excellent for swing/positional traders eyeing structured, institutional-grade setups.
🔷 ICRA – Multi-Timeframe Demand-Based Trade Plan (Refined)
🔹 Market Structure & Technical Alignment
Timeframe Trend Zone Type Demand Zone (₹) Avg Price
Yearly UP BUFL + Breakout 4699 – 4275 4487
Half-Yearly UP BUFL + Breakout 4699 – 4275 4487
Quarterly UP BUFL + Breakout 6450 – 4983 5717
HTF Avg UP — 5283 – 4511 4897
| Monthly | UP | BUFL | 5909 – 5015 | 5462 |
| Weekly | UP | BUFL & Swap | 6570 – 6051 | 6311 |
| Daily | UP | BUFL / DMIP | 6570 – 6051 | 6311 |
| MTF Avg | UP | — | 6350 – 5706 | 6028 |
| 60M/180M/240M | UP | DMIP | 6570 – 6426 | 6498 |

COAL INDIA🎯 Trade Plan – Positional Buy
Parameter Value
Entry ₹383
Stop Loss ₹375
Risk ₹8
Target ₹738
Reward ₹355
R:R 44.4x
Last High ₹544
Last Low ₹350
✅ Key Technical Highlights
✅ All Timeframes Aligned Bullish – strong confluence across HTF, MTF, and ITF.
✅ Entry Zone Overlaps: Monthly, Qtrly, Half-Yearly all cluster at ₹383–375.
✅ Microstructure Support: Strong base formation at ₹375 confirmed by all intraday frames.
✅ Breakout Confirmation: Quarterly candle breakout further strengthens bullish case.
✅ Excellent R:R – Minor risk with exponential potential.
🧠 Execution Strategy
Entry Range: ₹383–380 (on minor retracement).
SL: ₹375 (below base of zone).
Initial Target: ₹544 (last swing high) – partial booking.
Final Target: ₹738 (based on HTF extension).
Trail aggressively post ₹450 to lock profits.
⚠️ Things to Monitor
Volume confirmation near ₹390–400 zone.
If ₹375 breaks with strength, reassess setup.
🧾 Verdict:
Grade-A High Probability Trade with minimal risk and multi-timeframe support. Strong structure, breakout confirmation, and institutional demand zones make this a compelling buy setup.
🔹 COAL INDIA – Multi-Timeframe Trade Setup (Refined)
🔸 Overall Structure: Strong Bullish Setup
Timeframe Trend Demand Zone Type Zone (₹) Avg Price
Yearly UP BUFL 256 – 208 232
Half-Yearly UP BUFL 383 – 375 379
Quarterly UP BUFL + Breakout 383 – 375 379
HTF Avg UP — 341 – 319 330
| Monthly | UP | RALLY-RALLY | 383 – 375 | 379 |
| Weekly | UP | DMIP | 372 – 342 | 357 |
| Daily | UP | BUFL / DMIP | 368 – 342 | 355 |
| MTF Avg | UP | — | 374 – 353 | 364 |
| 240M/180M/60M | UP | DMIP | ~375 – 373 | 375 |

BALBRISHNA IND🎯 Trade Plan – Positional Buy
Parameter Value
Entry ₹2,379 OR CMP
Stop Loss ₹2,193
Risk ₹186
Target ₹4555
Reward ₹2151
Risk: Reward 25.5
Last High ₹3,375
Last Low ₹2,194
🔍 Key Technical Highlights
✅ Confluence of Demand Zones (Daily + Weekly + Monthly at 2379–2193) = Strong Buy Signal.
✅ MTF & HTF Alignment: All major timeframes in clear uptrend.
✅ Fresh Zones: No violation of base, entry is at untouched zone.
✅ Strong Risk Management: SL just below structural low of ₹2,194.
✅ Massive Upside Potential: ₹7,120 could be a multi-year breakout target.
⚙️ Execution Strategy
Entry Range: ₹2,370–₹2,385 (within demand zone).
SL: ₹2,193 (below daily demand base).
Trail Strategy:
Trail SL to cost once ₹2,650 crosses.
Partial profit at ₹3,375 (last swing high).
Hold for extended targets using trailing method above ₹4,000.
⚠️ Watch For
Intraday rejection at 240M SOE (~₹2,455).
Volatility spikes near previous low of ₹2,194.
🧠 Final View:
High-quality positional trade with deep zone alignment and excellent R:R. Entry at strong institutional footprint with potential for exponential move. A+ setup.
📊 Multi-Timeframe Analysis Summary:
Timeframe Trend Demand Zone Type Zone (Proximal–Distal) Avg Price
Yearly UP BUFL 1720–1516 1618
Half-Yearly UP RBR 2724–1690 2207
Quarterly UP BUFL / RBR 2795–1690 2243
Monthly UP DMIP 2379–2193 2286
Weekly UP DMIP 2379–2193 2286
Daily UP DMIP 2264–2193 2229
60m / 180m / 240m UP DMIP/SOE ~2430–2380 range ~2400 avg
🔹 BALKRISHNA – Multi-Timeframe Trade Setup (Refined)
🔸 Trend Summary – All Timeframes: Strong Bullish
Timeframe Trend Demand Zone Type Zone (₹) Avg (₹)
Yearly UP BUFL 1720 – 1516 1618
Half-Yearly UP RBR 2724 – 1690 2207
Quarterly UP BUFL / RBR 2795 – 1690 2243
Monthly UP DMIP 2379 – 2193 2286
Weekly UP DMIP 2379 – 2193 2286
Daily UP DMIP 2264 – 2193 2229
Intraday (60/180/240m) UP SOE / DMIP 2383 – 2457 2400

PGEL ANALYSIS: WAIT FOR RIGHT MOMENT FOR HUGE GAINSThanks for stopping by.
All analysis here is done strictly from an investor’s perspective — focusing on risk, return, valuation, and potential upside.
The notes cover key details. I’ve backed every thesis with my own analysis — no fluff, just what matters to investors.
If you find the idea useful or have suggestions, feel free to leave a comment. Always open to fresh insights.
Kind regards,
Psycho Trader

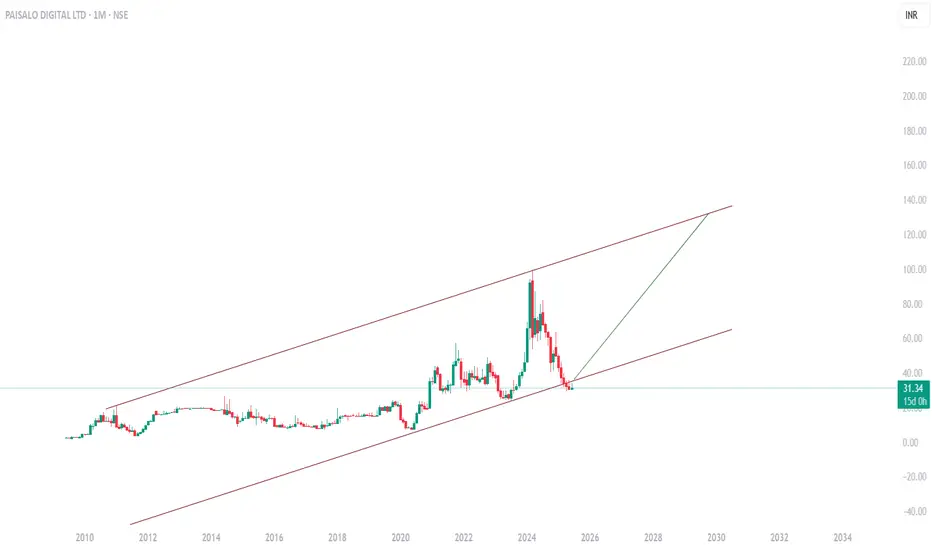
Paisalo Digital can be 5x baggerCheapest stock in NBFC sector backed by LIC.
This stock can rise like railway stocks
cmp 31 target 75, 130 plus
start accumulating all the dips
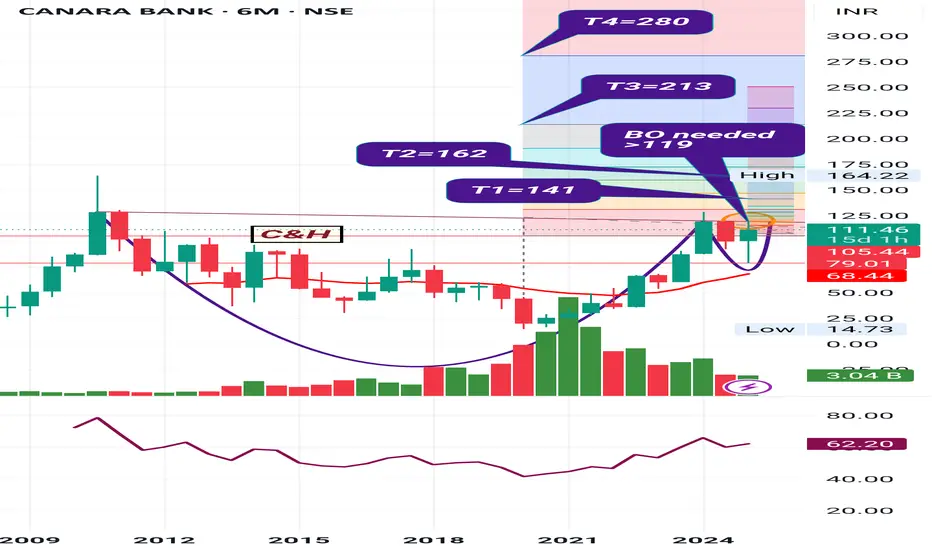
Canara Bank*Canara Bank Ltd.*
C&H; Formation on Decadal basis.
Strong Bouceback from Support Zone.
Volume Traction picking up.
RSI: 1H W>M. Above 1H, All in Bullish zone.
EMAs: Widening Gaps amongst 50 /100 /200 levels on Monthly Basis.
*Trail SL with Upside*
*Book Profit as per Risk Appetite*
Improving Financials. Rising Revenue on Qtrly /Yrly basis. Improving GNPA/NNPA levels. Improving CRAR.
Promoter Stake Constant. FII Declined/DII Increased.
*This is an Opinion. Do your own research as well.*
*_Happy Investing_*🤓
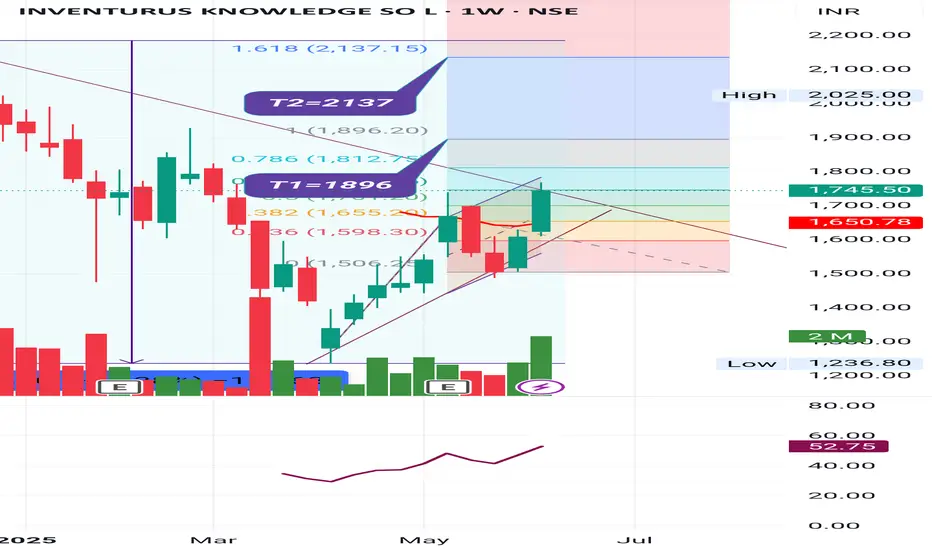
Inventurus Knowledge Solutions Ltd *Inventurus Knowledge Solutions Ltd.*
Rising P&F; formation on Weekly basis.
Strong Bounce back (Post fall of 43%) from Support Zone.
Volume Traction picking up.
RSI: 1H W. All in Bullish zone.
EMAs: Death Cross approaching on Daily Basis.
*Trail SL with Upside*
*Book Profit as per Risk Appetite*
Improving Financials. Rising Revenue on Qtrly /Yrly basis. Consistent Profitability Margins. Growing TNW, reducing debt levels, Acceptable WC Cycle. +ve CF from Ops. ~Consistent RoE / ROCE/ RoA
Promoter Stake constant. Marginal decline FII/DII Stake.
*This is an Opinion. Do your own research as well.*
*_Happy Investing by IdeasNeosagi_*🤓
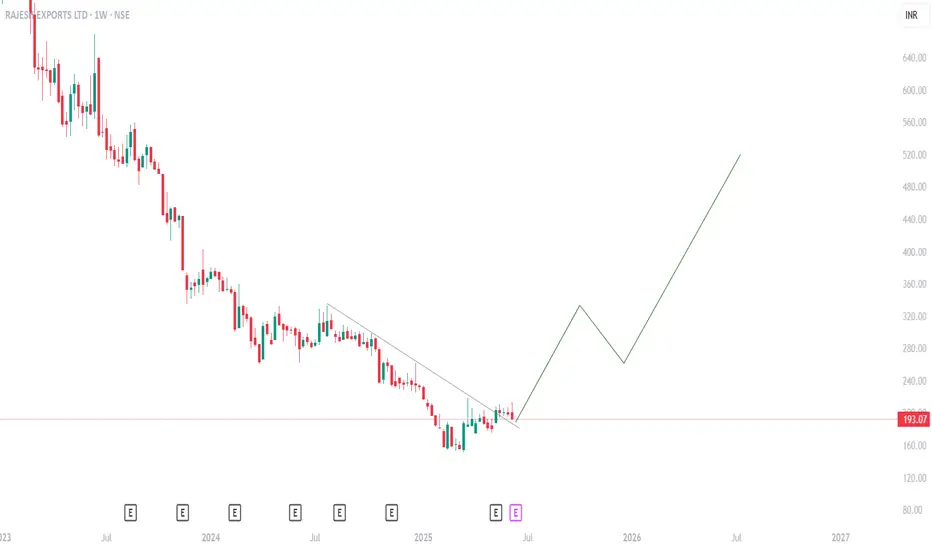
Can be 2x from hereBuy Rajesh exports cmp 197 target 330, 540
Promoter is buying from open market.
Available at dirt cheap price.
Let battery manufacturing kick start.
Any good new will lift the stock 350 levels quickly
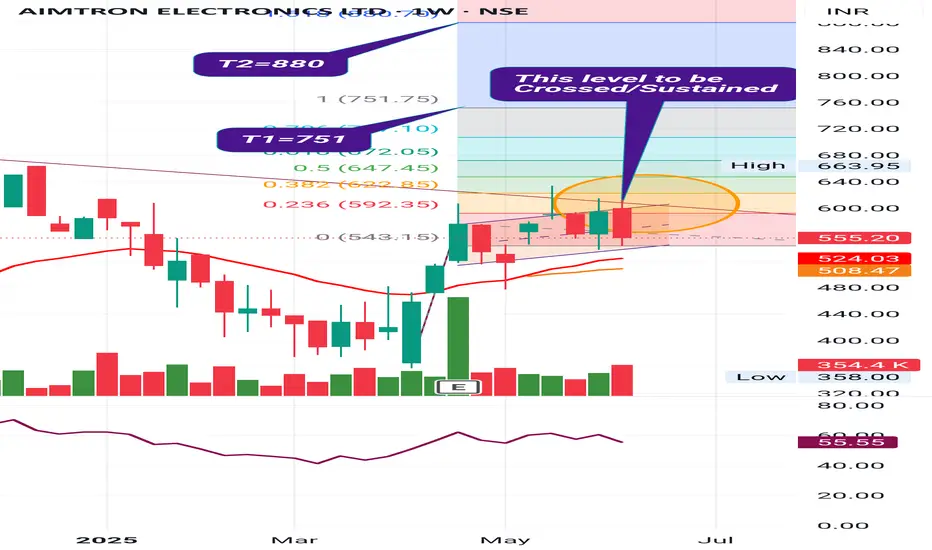
Aimtron Electronics Ltd *Aimtron Electronics Ltd.*
P&F on Weekly basis.
Need to cross 611 and to be sustained. Then good to go.
*Trail SL with Upside*
*Book Profit as per Risk Appetite*
Strong Financials. Rising Revenue on Qtrly /Yrly basis. Consistent Profitability Margins. Nil Debt levels. Growing TNW, Acceptable WC Cycle. Sharp Increase in DII Stake / Decline in FII Stake.
*This is an Opinion. Do your own research as well.*
*_Happy Investing by IdeasNeosagi_*🤓
Wockpharma is looking good to buy around 1400wockpharma is looking stronger but for short term it will fall till 1350 to 1400 that level is good to buy for good returns, so lets watch observe price action
