Positional Setup for Shakti Pumps (India) Ltd (NSE)CMP: ₹978.50
Breakout Zone: ₹1,030–1,070
Support Zone: ₹850–860
Price Action: Price is consolidating just below resistance, creating a base near the breakout zone.
📈 Technical View (Positional)
Price has shown strong recovery from the support zone (~₹850), moving towards a crucial resistance area at ₹1,030–1,070.
This zone has acted as a major supply zone in the past — a clean breakout above ₹1,070 could trigger fast upside.
Short-term pullback offers a good accumulation range before breakout attempt.
🚀 Positional Levels:
Entry Range: ₹960–985
Target 1: ₹1,070
Target 2: ₹1,180
Target 3: ₹1,320
Stop-Loss (Closing Basis): ₹935

Sundaram Finance - Cup Pattern breakoutSundaram Finance Holdings Ltd.
CUP pattern breakout on WEEKLY timeframe.
Multiyear High.
High Trade and Delivery Quantity this week.
Close within 52 week zone.
Disclaimer:
For educational purpose only.
Please do your own research before taking any trades.
Happy Trading!

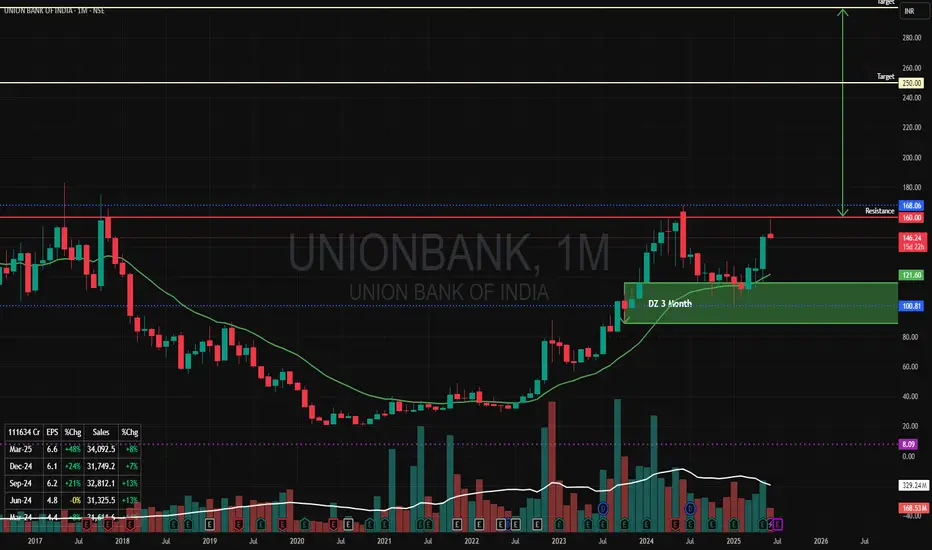
"Union Bank of India" Cup & Handle PatternI can see a Cup & Handle Pattern in Union Bank of India in Monthly Time Frame. Price is also coming from Monthly Demand Zone.
Rs 160 is a a Resistance line to break this Pattern.
Once we see a breakout of this level of Rs 160 Upside with a Good Volume (Increased from Previous Months) the Price can double from here to Rs 300 in next 12 months time.
first Target Rs 250/-
Second Target RS 300/-
Lets Hope for the Best!
BEMLNSE:BEML
One Can Enter Now ! Or Wait for Retest of the Trendline (BO) Or wait For better R:R ratio
Note :
1.One Can Go long with a Strict SL below the Trendline or Swing Low of Daily Candle.
2. Close, should be good and Clean.
3. R:R ratio should be 1 :2 minimum
4. Plan as per your RISK appetite
Disclaimer : You are responsible for your Profits and loss, Shared for Educational purpose

CAPRI GLOBAL CAPITAL LIMITED 1DCapri Global Capital Limited is currently trading around ₹176. The stock has recently broken a key resistance level with significant volume, indicating strong upward momentum. This development suggests potential for further gains, with a possibility of testing or surpassing its all-time high.
Disclaimer: The information provided is for educational and informational purposes only and should not be considered as financial advice. Investing in the stock market involves risk, and past performance is not indicative of future results. Please consult with a certified financial advisor or conduct your own research before making any investment decisions. We are not responsible for any losses incurred as a result of using this information. Stock market investments are subject to market risks; read all related documents carefully.

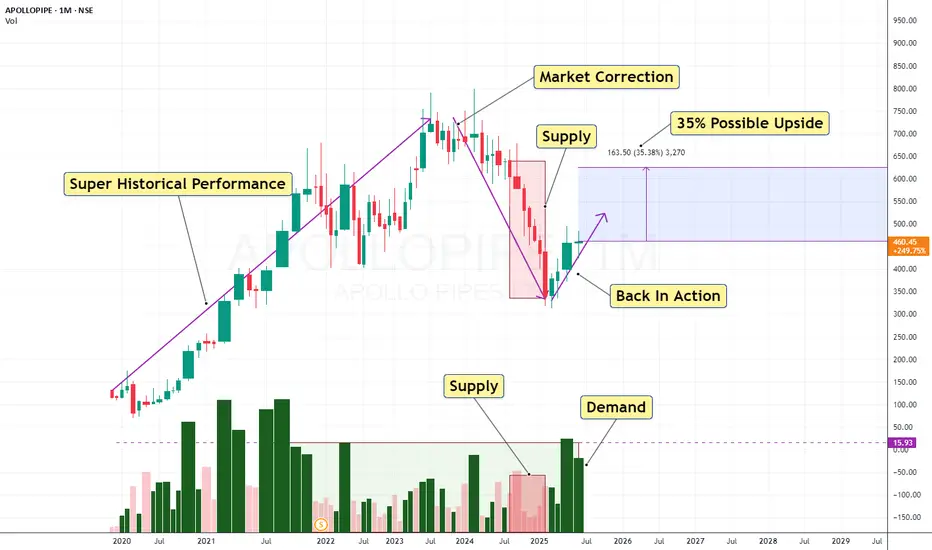
APOLLOPIPE LONG TERM ANALYSISThanks for stopping by.
All analysis here is done strictly from an investor’s perspective — focusing on risk, return, valuation, and potential upside.
The notes cover key details. I’ve backed every thesis with my own analysis — no fluff, just what matters to investors.
If you find the idea useful or have suggestions, feel free to leave a comment. Always open to fresh insights.
Kind regards,
Psycho Trader
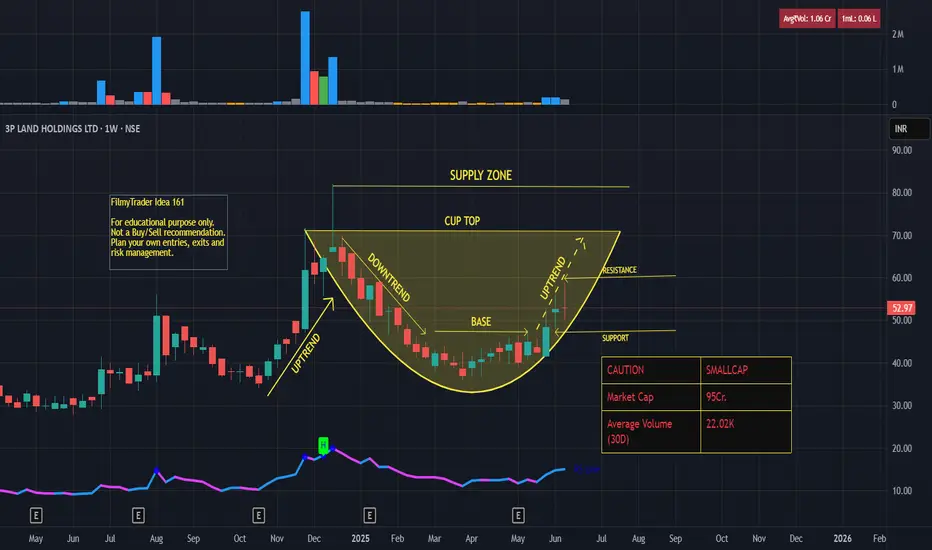
3PLand - Positional Trade Idea - Cup Pattern3P LAND HOLDINGS LTD.
CAUTION - SMALL CAP
Market Cap - 95 Cr.
Average Volume (30D)-22.02K
Forming a CUP PATTERN in WEEKLY timeframe.
Probable Short Term Positional Trade opportunity.
Timeframe - Few Weeks, if the uptrend continues to complete the CUP Pattern.
Disclaimer:
For educational purpose only.
Please do your own research before taking any trades.
Happy Trading!
1001 Above sustain and go to all time high Strong fundamental
Strong double bottom support
Clear technical support
My recommendation:
Buy CMP
Easy target 🎯 1001
1001 above sustain all time high

BreakoutAn inverse head and shoulders pattern is a bullish chart formation that signals a potential reversal from a downtrend to an uptrend. It indicates that the price of an asset is likely to rise after a period of decline
Technical Trend Analysis of Tata Consultancy Services (TCS) Tata Consultancy Services (TCS), a leading player in the IT services sector, has recently garnered attention for its potential volume increase, making it a focal point for technical analysis.
This blog post delves into the current technical trend analysis of TCS stock (NSE: TCS) based on the 1-day chart.
Selection Rationale
TCS was selected for this analysis due to its observed potential for increased trading volume, a critical indicator of market interest and price movement. The analysis employs a trendline drawn from the highest highs to capture the stock's directional momentum, complemented by Fibonacci retracement levels to identify key support and resistance zones.
Trendline and Fibonacci Analysis
The primary trendline, established from the peak highs, indicates a downward trajectory over the observed period. This suggests a bearish sentiment prevailing in the short term. Overlaying the Fibonacci retracement tool, the price action reveals significant support at the 0.236 level, currently aligning around INR 3,445.70. This level has historically acted as a strong support zone, where the stock price has demonstrated resilience against further declines.
Key Support and Resistance Levels
Resistance Levels: The chart highlights resistance at INR 3,660.00 (0.5 Fibonacci level), INR 3,936.90 (0.618 level), and INR 4,176.50 (0.786 level), with the upper bound nearing INR 4,600.00.
Support Levels: Beyond the current support at INR 3,445.70, additional support is noted at INR 3,200.00, with a potential downside to INR 3,055.50 if the trend continues.
Volume Insights
The volume bars at the bottom of the chart reflect intermittent spikes, particularly around key price movements. This corroborates the selection criterion of potential volume increase, suggesting that significant buying or selling pressure could influence future price action.
Conclusion
The technical analysis of TCS indicates a bearish trendline with the stock currently testing a critical Fibonacci support level at 0.236 (INR 3,445.70). Investors and traders should monitor this level closely, as a break below could signal further downside, while a rebound may indicate a reversal or consolidation. Given the potential for volume-driven movements, staying attuned to market developments will be essential for informed decision-making.
For a more comprehensive analysis or real-time updates, consider utilizing advanced tools and platforms like TradingView, and consult with a financial advisor for personalized investment strategies.
Disclaimer: This analysis is for educational purposes only and should not be considered financial advice. Always conduct your own research and consult with a professional before making investment decisions.

NAVA LIMITED – Bullish breakout in 1d soonNAVA Limited is currently exhibiting strong bullish momentum, supported by both technical indicators and improving fundamentals. The stock has shown a sustained uptrend with higher highs and strong volumes, indicating buyer dominance.
✅ Key Bullish Factors:
📊 Strong Fundamentals: Consistent profitability with solid EBITDA margins and minimal debt. Recent buyback reflects management's confidence in the company.
💡 Technicals in Favor: Price trading above key moving averages (20/50/100 EMA), showing strong trend continuation.
🔄 Breakout Confirmation: Stock recently broke past a key resistance zone and is now forming a new base, suggesting potential for the next leg up.
📈 Momentum Indicators: RSI above 60, MACD showing bullish crossover, and volume buildup on green candles.
🏭 Diversified Business: Exposure to energy, ferro alloys, and mining – adding stability and growth potential.
🎯 Potential Upside Levels:
Immediate Target: ₹658
🔒 Stop-Loss: ₹419 (Below key support or recent swing low)
📌 Strategy: Ideal for swing or positional traders looking for high-probability setups with risk-reward in favor.
🧠 Disclaimer: This is not investment advice. Please conduct your own analysis or consult a financial advisor before making any trading decisions.

SIEMENS LTD Long Term Trend OutlookSIEMENS has maintained a strong multi-year bullish trend since its 2009 low of ₹97.36, consistently respecting a well-anchored ascending channel. After a major rally peaking at ₹4,164.15, price is now reacting to a major supply zone, showing initial signs of distribution.
We should monitor a potential retracement towards the ₹1,400.95 re-accumulation zone, which aligns with the historical demand area and the lower boundary of the long-term trendline. This confluence may provide a high-probability re-entry point for long-term investors seeking continuation exposure.
As long as the macro structure holds above the trendline, the long-term bullish thesis remains intact. A failure below the re-accumulation zone would signal a significant structural shift.

VST Tillers Tractors Ltd: A Compelling Case for Value InvestingIn the dynamic Indian stock market, finding such opportunities requires diligent research and a keen eye for businesses with intrinsic value. One such stock that stands out as a potential value investment is VST Tillers Tractors Ltd. (VSTTILLERS), a leading player in India’s agricultural equipment sector. Based on an analysis of its profile on Screener.in, this blog explores why VST Tillers is an attractive pick for value investors.
Understanding VST Tillers Tractors Ltd.
Founded in 1967 by the VST Group, a century-old business house in South India, VST Tillers Tractors Ltd. has established itself as a pioneer in the agricultural machinery sector. The company is the largest manufacturer of power tillers in India, holding over 70% market share, and is a significant player in the compact tractor segment under its VST SHAKTI and FIELDTRAC brands. Initially a joint venture with Mitsubishi Heavy Industries, Japan, VST Tillers is now independently operated, with the VST family holding a 51% promoter stake, signaling strong management confidence in its future. The company also exports to European, Asian, and African markets, aligning its products with stringent EU standards.
With a market capitalization of approximately ₹3,032.65 crore as of April 2025, VST Tillers operates in the automobile sector, specifically in the tractors and farm equipment industry. Its financials, operational efficiency, and strategic initiatives make it a compelling candidate for value investors seeking undervalued stocks with growth potential.
Why VST Tillers is Attractive for Value Investing
Value investing hinges on finding companies trading below their intrinsic value, with strong fundamentals, low debt, consistent dividends, and growth prospects. Here’s why VST Tillers aligns with these principles:
1. Strong Fundamentals and Financial Stability
Near Debt-Free Status: VST Tillers is virtually debt-free, a hallmark of a financially sound company. Low debt reduces financial risk and allows the company to reinvest profits into growth initiatives or reward shareholders.
Healthy Dividend Payout: The company maintains a consistent dividend payout ratio of around 19.9%, with a current dividend yield of 0.57%. This reflects a shareholder-friendly approach, providing steady income while retaining earnings for reinvestment.
Stable Promoter Holding: With a 55.6% promoter stake, there’s strong alignment between management and shareholders. The promoter holding has remained stable over recent quarters, indicating confidence in the company’s long-term prospects.
2. Undervaluation Relative to Peers
Price-to-Earnings (P/E) Ratio: VST Tillers trades at a P/E ratio of 25.05, which is reasonable for a company with its market leadership and growth prospects. Compared to peers in the automobile and tractor industry, this P/E suggests the stock may be undervalued, especially given its niche dominance in power tillers.
Market Cap and Growth Potential: With a market cap of ₹3,032.65 crore, VST Tillers is a mid-cap stock with room for growth. Its focus on expanding into higher horsepower tractors and international markets (now 13% of revenue, with a target of 25-30%) positions it for future appreciation.
3. Consistent Operational Performance
Revenue and Profitability: In FY 2022-23, VST Tillers crossed the ₹1,000 crore revenue milestone, showcasing its ability to scale. In Q2 FY 2025, the company reported a modest revenue increase driven by stable demand for power tillers, with profits at ₹105 crore. While sales growth over the past five years has been modest at 9.50%, the company’s focus on operational efficiency and cost management supports profitability.
International Expansion: The company’s export business is growing, with products like FIELDTRAC tractors meeting EU standards. International revenue now accounts for 13% of total revenue, with plans to expand into the U.S. and European markets. This diversification reduces reliance on the domestic market and enhances growth prospects.
Sales Surge: In March 2025, VST Tillers reported a 142.09% sequential increase in total sales, with power tiller sales jumping 77.81% year-on-year to 7,221 units. While tractor sales dipped slightly, the overall sales momentum reflects strong demand and operational resilience.
4. Long-Term Growth Catalysts
Product Diversification: VST Tillers is expanding its portfolio beyond power tillers to include higher horsepower tractors, power weeders, and precision components. A recent joint venture has enabled the launch of advanced tractors, strengthening its competitive position.
Distribution Network Expansion: The company is investing in its dealer network to enhance market reach, particularly in rural India, where small farm mechanization is gaining traction. This aligns with favorable agricultural conditions and government support for farm mechanization.
Sustainability and Innovation: VST Tillers’ focus on fuel-efficient, reliable products like the VST 9054 tractor (praised by farmers in Tanzania for its performance) and multi-crop reapers positions it to meet evolving farmer needs. Its brush cutters and power reapers cater to modern farming demands, ensuring relevance in a changing agricultural landscape.
5. Resilience in a Cyclical Industry
The agricultural equipment sector is cyclical, influenced by monsoons, commodity prices, and government subsidies. However, VST Tillers has demonstrated resilience through:
Market Leadership: Its 70% share in the power tiller market provides a competitive moat, insulating it from new entrants.
Stable Demand: Small and marginal farmers, who form the bulk of India’s agricultural workforce, rely on affordable, efficient equipment like power tillers, ensuring steady demand.
Strategic Execution: The company’s focus on dealer profitability and retail financing aligns with shifting consumer behavior, reducing dependence on subsidies and enhancing sales stability.
6. Risks and Considerations
While VST Tillers is a strong value investment candidate, there are challenges to consider:
Modest Sales Growth: The company’s five-year sales growth of 9.50% is relatively low, reflecting challenges in scaling the tractor segment.
Low Return on Equity (ROE): An ROE of 13.3% over the past three years is below the ideal threshold for growth companies, indicating room for improvement in capital efficiency.
Working Capital Challenges: Debtor days have increased from 40.7 to 54.1 days, and working capital days have risen from 80.4 to 173 days, suggesting potential inefficiencies in cash flow management.
Commodity Price Volatility: Rising input costs have pressured operational EBITDA, which stands at 13.33% (excluding other income). Value investors should monitor cost management strategies.
Despite these risks, VST Tillers’ strong balance sheet, market leadership, and growth initiatives mitigate concerns, making it a compelling long-term investment.
Value Investing Perspective: Why VST Tillers Stands Out
Value investors seek stocks with a margin of safety, where the market price is below the intrinsic value. VST Tillers fits this mold due to:
Undervalued Stock Price: The stock’s 52-week range (₹3,082 to ₹5,429.95) and current price of ₹3,565.95 (as of April 2025) suggest it is trading at a discount relative to its growth potential and market leadership.
Long-Term Growth Story: The company’s focus on international markets, product diversification, and rural market penetration aligns with India’s agricultural mechanization trend, offering significant upside potential.
Patience Pays Off: VST Tillers is a case study in patient investing. Its consistent growth and market dominance reward investors willing to hold for the long term.
Conclusion:
VST Tillers Tractors Ltd. embodies the principles of value investing: a fundamentally strong company with low debt, consistent dividends, and a clear growth trajectory, trading at a reasonable valuation. Its leadership in the power tiller market, strategic expansion into tractors and international markets, and resilience in a cyclical industry make it an attractive pick for investors seeking undervalued opportunities in the Indian stock market.
For value investors, VST Tillers offers a compelling mix of stability and growth. While challenges like modest sales growth and working capital inefficiencies warrant monitoring, the company’s strong fundamentals and strategic initiatives provide a solid foundation for long-term wealth creation. As with any investment, thorough due diligence is essential, but VST Tillers stands out as a hidden gem worth considering for a value-focused portfolio.
Disclaimer: This blog is for informational purposes only and not a recommendation to buy or sell securities. Always conduct your own research or consult a financial advisor before investing.

BERGEPAINT at Best Support !!This is the Daily Chart of BERGEPAINT .
BERGEPAINT having good law of polarity at 540-545 range.
EMA is also providing support for the stock around the 545 range.
If this level is sustain the , We may see higher price in BERGEPAINT.
Thank You !!

TECH MAHINDRA is now moving towords upwords 1740TECH MAHINDRA Is showing momentum after clean liquidity sweep , it will take time within 4 days it will touch 1740, lets see price action

LT will move upside nowLT is now in momentum after liquidity sweep, so soon it will touch our targets within one month lets see , how it behaves

MAX HEALTHCARE INS LTD good to BUYMAX HEALTHCARE INS LTD 1072 is on the verge of its resistance. Signals are bullish after hidden divergence suggests it could be considered for buy for target 1371.
Consolidated sales growth is 26% and profit growth of 100% for last 5 years.
FII's holding is more than 50 %.

SBIN has given a Spring SBIN 779 has given a Spring pattern for target 811.
Positive volume comparatively more.

VinatiOrganics on Breakout ?VinatiOrganics 1621 is showing breakout on charts.
Trading at 42 P/E and is healthy dividend payout among chemical sector we expect it could move to 1960.
An investment could be considered with 1590 support.

PVR INOX LTD at Support Zone.This is the 4 hours Chart of PVRINOX.
PVRINOX having good law of Polarity at 930 range.
If this level is sustain , then we may see higher prices in PVRINOX.
Thank You !!

Positional Setup for PSP Projects Ltd (NSE)Positional Setup for PSP Projects Ltd (NSE)
CMP: ₹691.00
Breakout Level: ₹675–680
Previous Resistance: ₹737
Indicators:
Supertrend: Bullish confirmation
TEMA 5/9/20: Strong upward slope
Volume/Price Action: Powerful breakout from long consolidation, tested higher resistance around ₹737, pulled back near breakout zone—healthy retest
📈 Technical View (Positional)
PSP Projects has broken out of a year-long consolidation.
Resistance at ₹737 was tested intraday, suggesting bulls are in control.
Now hovering near breakout zone, offering a low-risk entry for positional trade.
🚀 Positional Targets:
Target 1: ₹737
Target 2: ₹804
Target 3: ₹838
Stop-Loss (Closing Basis): ₹655

NESTLE INDIA SWING TRADE SETUP📊 Price Action & Trend Analysis
Analyzing market trends using price action, key support/resistance levels, and candlestick patterns to identify high-probability trade setups.
Always follow the trend and manage risk wisely!
Price Action Analysis Interprets Market Movements Using Patterns And Trends On Price Charts.
👉👉👉Follow us for Live Market Views/Trades/Analysis/News Updates.

ADANI GREEN LONG TRADE SETUP📊 Price Action & Trend Analysis
Analyzing market trends using price action, key support/resistance levels, and candlestick patterns to identify high-probability trade setups.
Always follow the trend and manage risk wisely!
Price Action Analysis Interprets Market Movements Using Patterns And Trends On Price Charts.
👉👉👉Follow us for Live Market Views/Trades/Analysis/News Updates.
