BAJAJ FINANCE 's Key Resistance Zone This is 4 hour chart of BAJAJ FINANCE
BAJAJ FINANCE having good Resistance at 9800 and 10200 range.
If this level is sustain , then we may see lower prices in BAJAJ FINANCE.
Thank You !!

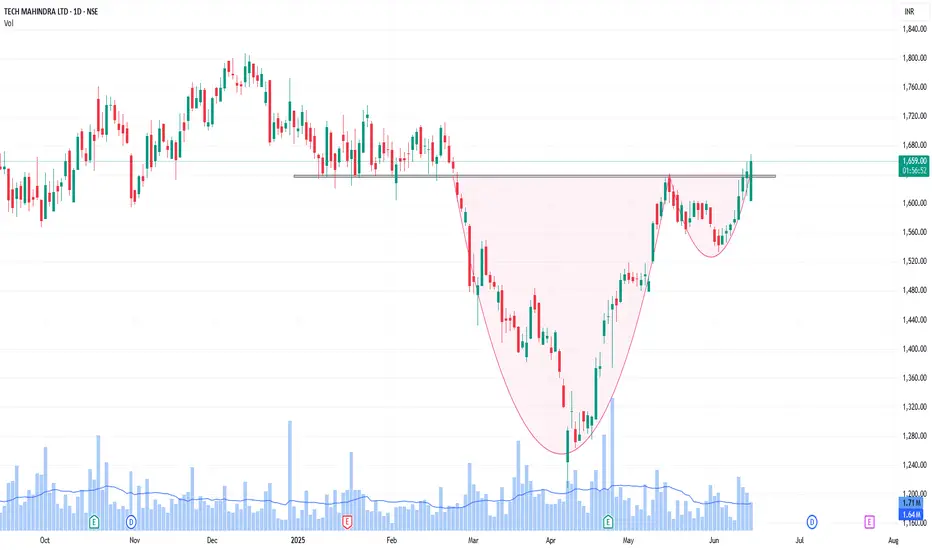
Techm - cup and holder breakoutNSE:TECHM
Cup and handle breakout in TechM
Also it breaking the long resistance 1630-1650

broking sector is bullish ?Broking sector is bullish as NSE listing is on news went thru some charts and mfsl gave me entry here definetly can go higher but I am happy wth 1:3

It sector turning bullishIT sector stocks are turning bullish and gaining on momentum took an entry on intellect as it near ath and ready to make new ath i am looking for 1:3 here

JINDALSAW Long Term AnalysisThanks for stopping by.
All analysis here is done strictly from an investor’s perspective — focusing on risk, return, valuation, and potential upside.
The notes cover key details. I’ve backed every thesis with my own analysis — no fluff, just what matters to investors.
If you find the idea useful or have suggestions, feel free to leave a comment. Always open to fresh insights.
Kind regards,
Psycho Trader

Oswal Agro Weekly Chart
RSWI above 60 Daily / weekly / Monthly
Small Cap Stock (Careful)
All time high crossed
52 week high also cross
93 support level
volume growth

HCL Tech Bullish V-shape head & Shoulder Pattern!If Giant IT company HCL tech come to retest its strong support near 1600 it would be best buying opportunity, I don't know it will come or not but the trade initiation 1600-1653 between 20 and 50 moving averages could become good opportunity to go long for short to medium term.
Buying Below -1653
Stop loss -1605
First target -1741
Second Target -1818
Risk Reward -1:3

Torrent Pharmaceuticals 1DTorrent Pharmaceuticals, currently trading around ₹3,200, is poised to potentially break its all-time high. The stock has formed a bullish triangle pattern, indicating strong upward momentum
Disclaimer: The information provided is for educational and informational purposes only and should not be considered as financial advice. Investing in the stock market involves risk, and past performance is not indicative of future results. Please consult with a certified financial advisor or conduct your own research before making any investment decisions. We are not responsible for any losses incurred as a result of using this information. Stock market investments are subject to market risks; read all related documents carefully.

ONGC available at fair value .. Good to BUY ONGC 239 is available at a FAIR VALUE with support 224. Fundamentally good stock and technically it could reach 290 which could give 20% return.

GE shipping Breakout GE Shipping 976 has given breakout and is testing its Mitigation block.
On valuation it is available at fair value .
We expect GE shipping will to targets 1010,1060

Redington Ltd - Breakout StockRedington Ltd is showing strong price action and is currently positioned as a breakout stock. The stock has surged above key resistance levels with supportive volume, indicating potential for further upside momentum.
📊 Traders and investors may consider keeping this stock on their watchlist for potential swing opportunities, subject to market conditions and proper risk management.

QUICKHEAL - LONG TERM ANALYSISThanks for stopping by.
All analysis here is done strictly from an investor’s perspective — focusing on risk, return, valuation, and potential upside.
The notes cover key details. I’ve backed every thesis with my own analysis — no fluff, just what matters to investors.
If you find the idea useful or have suggestions, feel free to leave a comment. Always open to fresh insights.
Kind regards,
Psycho Trader

DR. REDDY Is becoming ready for downfallAfter proper price action formation DR. REDDY may fall sharply , my target for next 6 months to one year is 665, lets see what happens, but all this after only confirmation

RHIM MAGNESITA will fall sharply after 579 touchRHIM MAGNESITA is in downtrend for long term and for short term its in uptrend till 579 ,
after touching 579 it may reverse sharply after confirming price action we can think to short it till 190
