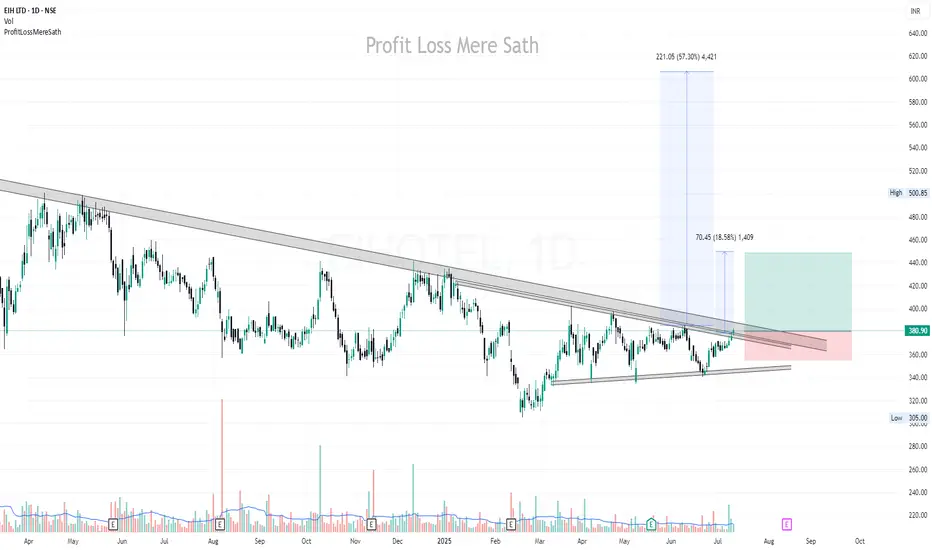
EIHOTEL | Buy @380 | SL below 355 | Targets 448, 490, 607Disclaimer:
This is not financial advice. Please do your own research or consult with a financial advisor before making any investment decisions. Investments in stocks can be risky and may result in loss of capital.
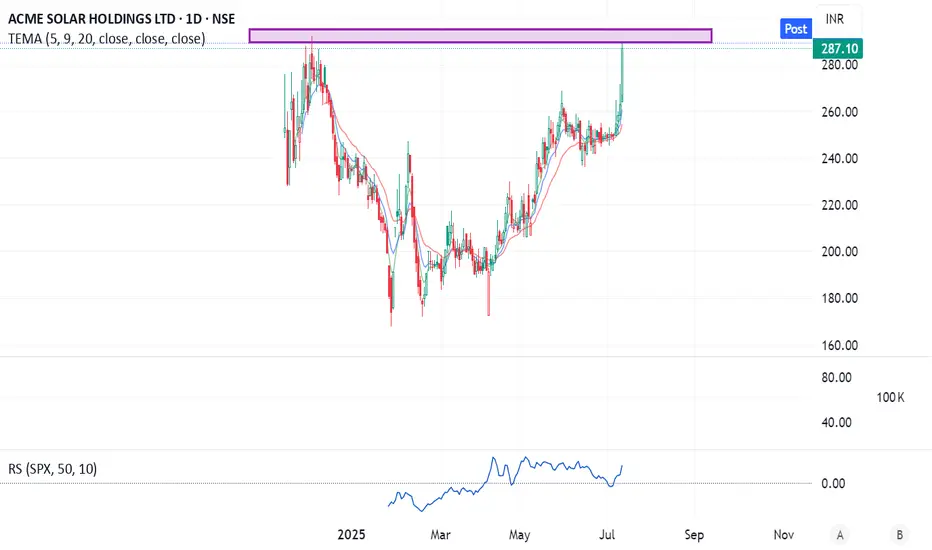
Positional trade setup for ACME Solar Holdings Ltd Technical Analysis (Daily Chart)
CMP: ₹287 approx
Pattern: Approaching major resistance zone at ₹290–295 (prior highs). Watch for a breakout or rejection.
EMA 5‑9‑20 Setup: EMAs are stacked bullish and trending upward, showing improved momentum.
Trade Entry: Wait for a decisive close above ₹295 (breakout confirmation).
Stop-Loss: Place below the breakout zone—daily close under ₹282.
Target Zones:
🎯 Target 1: ₹320 (next swing high)
🎯 Target 2: ₹360+ (momentum continuation zone)
🏭 Fundamental Snapshot
Metric Value
Market Cap ~₹17,000 Cr
P/E (TTM) ~60×
P/B Ratio ~3.3×
ROE (TTM) ~9.7%
ROCE ~7.5–7.8%
Dividend Yield ~0.1%
Debt to Equity ~2.3×
Altman Z‑Score ~1.1 (suggests financial stress)
Free Cash Flow Negative (investing-heavy)
Business Highlights:
One of India’s top 10 renewable IPPs with 1.8 GW operational capacity and 3.25 GW under construction.
Strong pipeline with big wins such as battery storage orders & FDRE (firm/dispatchable renewables) projects.
Recent growth: Revenue ~₹15,750 Cr (+19% YoY), Net Profit ₹2,520 Cr.
Backing industry push into energy storage—recent 3.1 GWh BESS order supports diversification.
Key Risks:
High leverage (Debt/Equity >2×), low Altman Z‑score indicates stress.
Negative free cash flow due to capex into expansion.
Valuation steep: P/E ~60×, limited dividend yield.
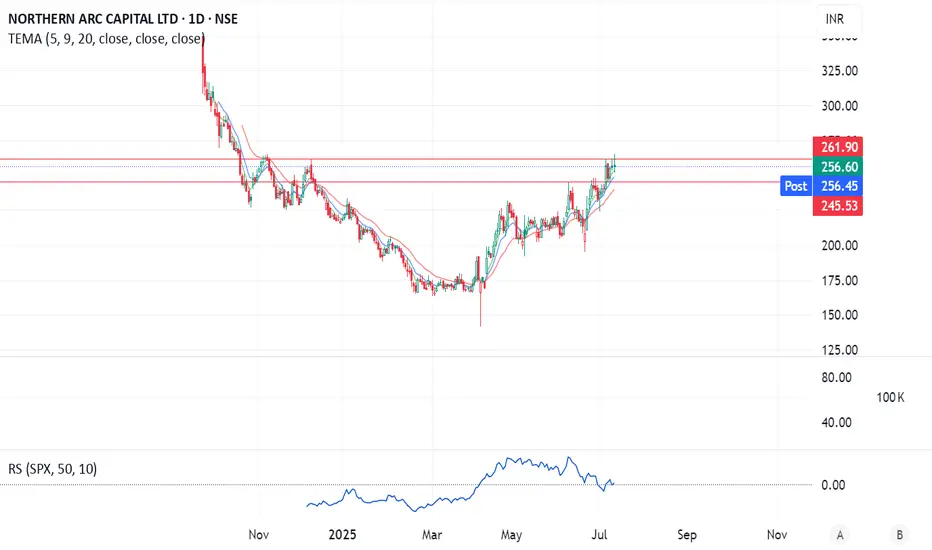
Positional setup for Northern Arc Capital Ltd (NSE: NORTHARC)Technical Analysis (Daily Chart)
CMP: ₹256.60
Structure: Recently broke above resistance around ₹245–255 on steady volume, with tight 5‑9‑20 EMA alignment signaling momentum shift to bullish.
Support Level: ₹245–250 (former resistance, now support).
Stop‑Loss: Daily close below ₹245.
Targets:
🥅 Target 1: ₹285 (next resistance)
🥅 Target 2: ₹320+
🏦 Fundamental Insights (Latest Numbers)
Metric Value
Market Cap ₹4,200 Cr (~₹4.1K Cr)
Screener
P/E Ratio ~12×
P/B Ratio ~1.2×
ROCE / ROE ~10% / ~12%
Net Profit CAGR (5Y) ~31%
Q4 Net Profit ₹47 Cr (Qs: ₹95 Cr → ₹47 Cr)
Dividends None currently
Interest Coverage Low—margin for higher finance cost
Summary: Northern Arc is a niche NBFC focusing on underserved credit. It offers strong growth (~31% profit CAGR) and attractive valuation (~12x P/E), but has limited dividend income and faces interest cost pressures.
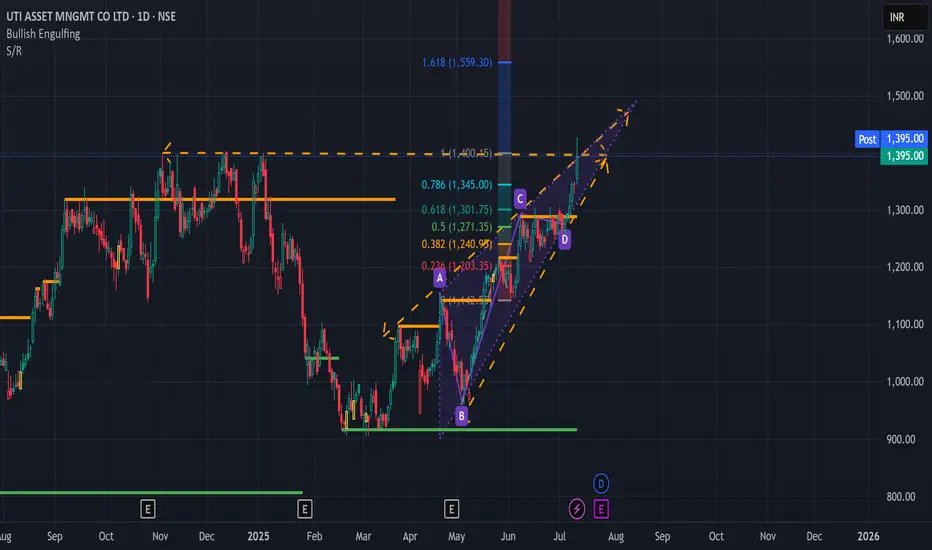
UTIAMC in Multi Month BreakoutNSE:UTIAMC in Multi Month Breakout. You can enter at current Point. 1st target would be 1500 and with Trailing stop loss we can make a Second target of 1550.
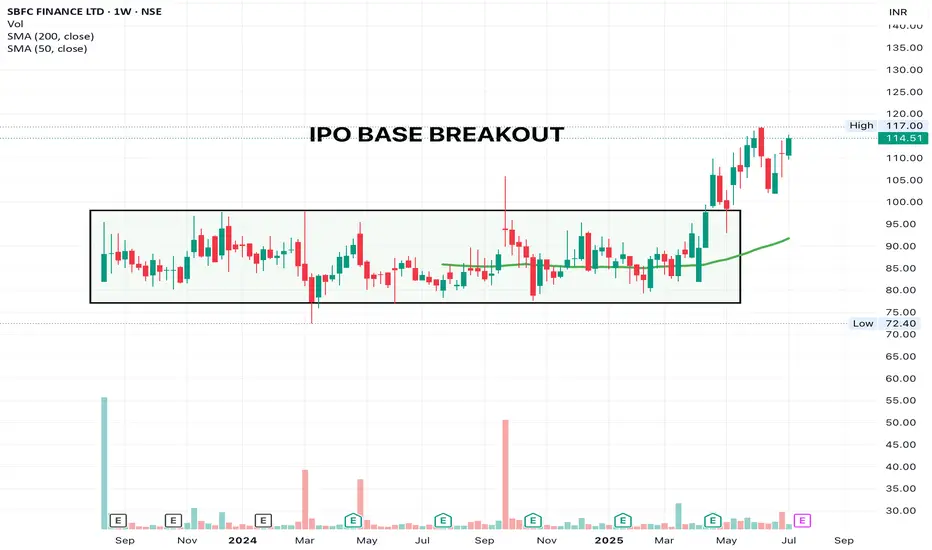
SBFC - RESISTING TO FALLStructures like this deserve a place in every portfolio. Buyers are ready to pounce on any shares available. This is why having sector tailwinds is so important.
SL - 101
Lupin At Best Support !! This is the 4 hour chart of Lupin .
Lupin appears to be forming a potential Three Drives bullish reversal pattern, with both drives terminating at the 1.27 Fibonacci extension level, indicating a possible exhaustion of the downtrend.
Lupin is trading within a well-defined descending channel. It has once again approached the lower boundary of the channel, which lies around the 1865–1880 zone, and is showing signs of a bounce.
If this level is sustain , then we may see higher prices in Lupin.
Thank You !!

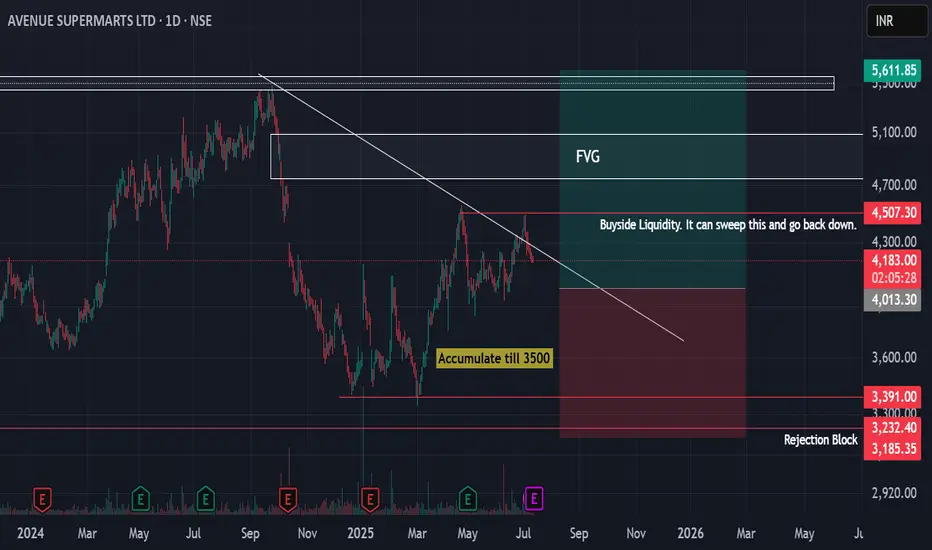
DMART Looking for some upside if everything goes smoothIn the short term, we can see a sweep of the buyside liquidity which has been marked.
For a longer term - atleast a year - one can accumulate for 5400-500 or higher levels.
A rejection block has been marked in case things go south
Hero MotoCorp — Daily Chart Breakout Trade SetupHero MotoCorp — Daily Chart Breakout Trade Setup
Range Bound: The stock has been consolidating between ₹4,170–₹4,400 for the past several weeks.
Structure: This is a classic rectangle consolidation, often a continuation pattern.
Volume: Watch for volume expansion on the breakout; prior breakouts lacked follow-through due to low volumes.
Higher Timeframe (Weekly/Monthly) charts show a bullish continuation since mid-May, with high-volume candles across weekly and monthly charts
Key resistance zones: Weekly resistance lies between ₹4,930–₹5,000.
Strong fundamental macro tailwinds: March sales show robust performance in both domestic ICE and EV segments (Vida)
🔍 Key Confirmation Signals for a Potential Trade
✅ Strong daily candle close above ₹4,420
✅ Above-average volume on breakout
✅ RSI crossing 60 on breakout adds momentum confirmation
⚠️ Risk Management Notes
Avoid early entry within the range (false breakouts possible)
Wait for EOD close above resistance for confirmation
Consider a trailing SL once the stock crosses ₹4,500

MAMATA - Head & Shoulder patternComment below what you observe in the chart.
All details are given on chart for educational purpose only. If you like the analyses please do share it with your friends, like and follow me for more such interesting charts.
Disc - Am not a SEBI registered analyst. Please do your own analyses before taking position. Details provided on chart is only for educational purposes and not a trading recommendation

SAGILITY 1D📈 Current Technical & Market Overview
Stock price: ₹43.95 – ₹44 range, with significant trading volumes (~38 million shares)
TradingView
+15
Moneycontrol
+15
The Economic Times
+15
52‑week range: ₹27.02 (low) to ₹56.40 (high – all‑time high)
Investing.com
+2
Investing.com
+2
ICICI Direct
+2
The stock is trading above all its key moving averages (5/20/50/100/200‑day), signaling strong bullish momentum
MarketsMojo
+1
The Economic Times
+1
🔍 Analyst Forecasts
TradingView consensus: ₹59 target (min ₹54, max ₹64)
Munafasutra
+3
TradingView
+3
Screener
+3
TipRanks consensus: ₹58.33 average target — ~33% upside
TipRanks
+1
Munafasutra
+1
AlphaSpread (Wall Street): Average ₹61.2, high-end ₹74.55 — suggesting up to ~68% upside
INDmoney consensus: ₹58.33 target — ~36% upside
Investing.com India
+10
Indmoney
+10
Trendlyne
+10
📰 Recent Events & Concerns
On May 27, 2025, promoter initiated a large stake sale (~₹2,671 Cr) via Offer For Sale, pushing the stock down ~5% to ₹40.70
Investing.com
+2
Investing.com India
+2
The Economic Times
+2
While this added short-term selling pressure, analysts remain optimistic given long-term fundamentals.
🧭 Outlook & Will It Break Its All‑Time High?
Technical strength: Strong upward trend and sustained high volumes – bullish short-to-mid term
Analyst price targets clustering in the ₹58–₹61 range: this would surpass the current high (~₹56), potentially setting a new all-time high.
Recent dip due to promoter selling is likely a short-term event, with support around ₹40–₹42 based on price history.
✅ Summary
Yes, Sagility India is showing strong signs of breaking its previous all-time high (~₹56).
Consensus analyst targets (~₹58–₹61+) imply room to run ~30–38% higher from current levels.
Risks remain: watch for promoter actions, macroeconomic changes, or sector-specific news.
🔎 What You Can Do Now
Watch support levels: ₹40–₹42 is a key short-term support zone.
Set target range: Entry near ₹44, aim for ₹58–₹60.
Monitor volumes & moving averages—continued high volumes above the 50/100 DMA would reinforce the uptrend.
Stay alert to news around promoter stake sale or earnings updates (Q1 performance expected soon).
Disclaimer: The information provided is for educational and informational purposes only and should not be considered as financial advice. Investing in the stock market involves risk, and past performance is not indicative of future results. Please consult with a certified financial advisor or conduct your own research before making any investment decisions. We are not responsible for any losses incurred as a result of using this information. Stock market investments are subject to market risks; read all related documents carefully.

AMBUJA CEMENT FOR SWINGA Good opportunity in Ambuja Cement for swing trade, weekly resistance break and retesting, so add in your watchlist.

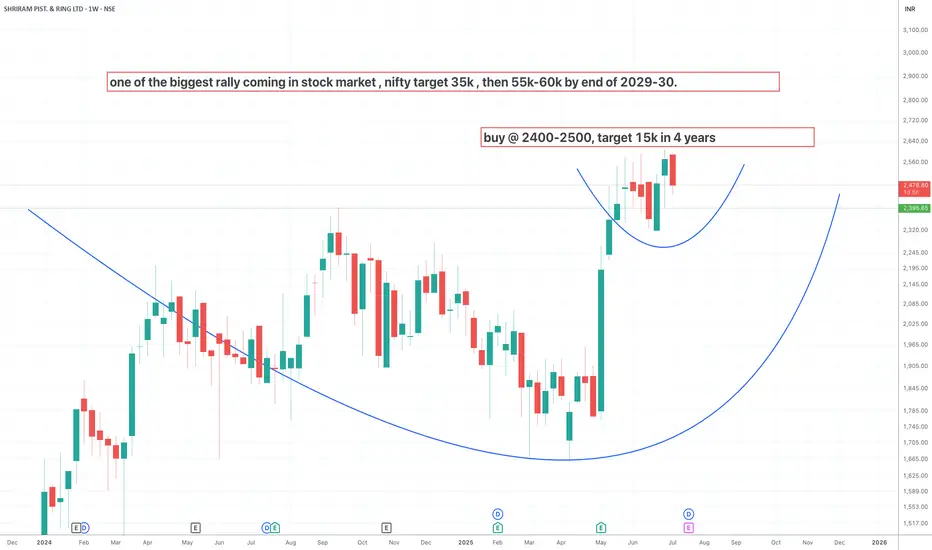
shriram piston buy at cmp 2500, target 15,000buy shriram piston at cmp , lomng term target 15,000 in 3 years.
cup and handle
INDIGO READY TO FLYINDIGO is nearing to all time high and now ready to FLY to make new Higher Highs.

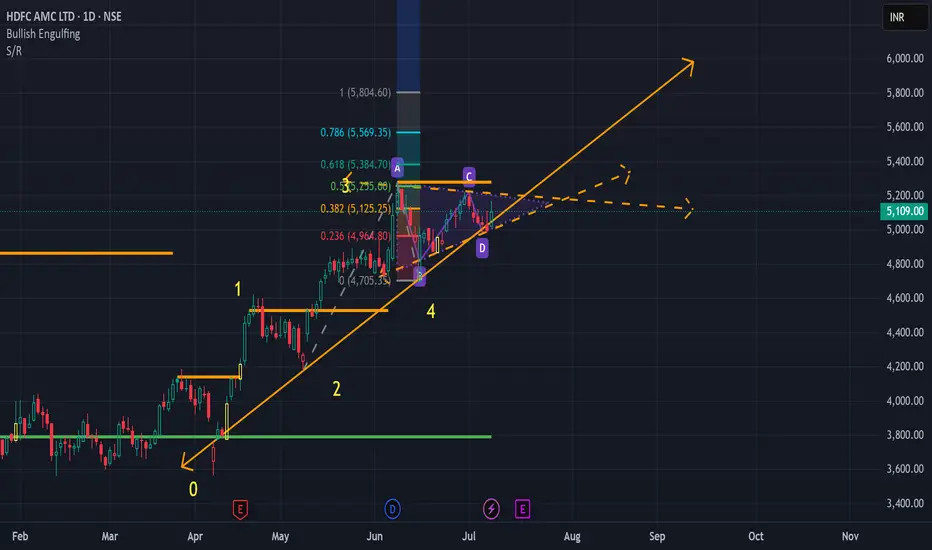
HDFCAMC in Pennant Trend PatternNSE:HDFCAMC shows a breakout of a Pennant Trend Pattern. Please Buy once there is a Bullish breakout. Target would be 5750
Positional Swing Trade Idea – GFL LTD 📌 Positional Swing Trade Idea – GFL LTD | Cup & Handle Pattern + Accumulation Zone
**GFL LTD (NSE\:GFL)** is showing a well-formed **Cup and Handle** pattern on the daily timeframe, with price action consolidating in a narrow range—indicating strength before a potential breakout.
🔍 **Technical Observations:**
* A well-rounded **cup base** has developed, signaling strong accumulation over time.
* A classic **handle** is now forming, showing controlled consolidation.
* The stock is currently **accumulating between ₹72.50–₹72.55**, creating a narrow resistance zone.
* Sustained movement and a breakout above this zone may lead to a **boombastic upside** move, backed by volume confirmation.
📈 **Trade Setup:**
* **Breakout Level to Watch:** ₹72.55+ on volume
* **Accumulation Range:** ₹72.50–₹72.55
* **Support:** Handle base and recent consolidation low
* **Potential Targets:** Based on pattern depth and momentum
The structure looks promising for a **positional swing trade**, especially if the price holds above the accumulation zone with strength.
⚠️ **Disclaimer:** This analysis is for educational purposes only. Please conduct your own due diligence before entering any trade.

DHUNSERI TEA & IND. LTD. swing/ Positional Trade opportunity### 📌 Positional Swing Trade Idea – DHUNSERI TEA & IND. LTD (DTIL) | Cup & Handle Pattern Forming
DHUNSERI TEA & INDUSTRIES LTD (NSE\:DTIL) is forming a classic **Cup and Handle** pattern on the daily chart, indicating a potential bullish breakout opportunity.
🔍 **Technical Highlights:**
* The cup is well-rounded, indicating strong accumulation over time.
* The handle is forming as a short consolidation/pullback, typical before a breakout.
* Price is approaching the **neckline resistance**, which if broken with volume confirmation, can signal a strong upward move.
📈 **Trade Setup:**
* **Breakout Zone:** Watch for a breakout above the neckline with volume.
* **Support:** Handle base acting as support.
* **Target:** Measured move based on cup depth offers a healthy upside.
This structure suits **positional and swing traders** looking for breakout trades with a defined structure and favorable risk-reward.
⚠️ **Disclaimer:** This idea is for educational purposes only. Please do your own analysis before making any trading decisions.

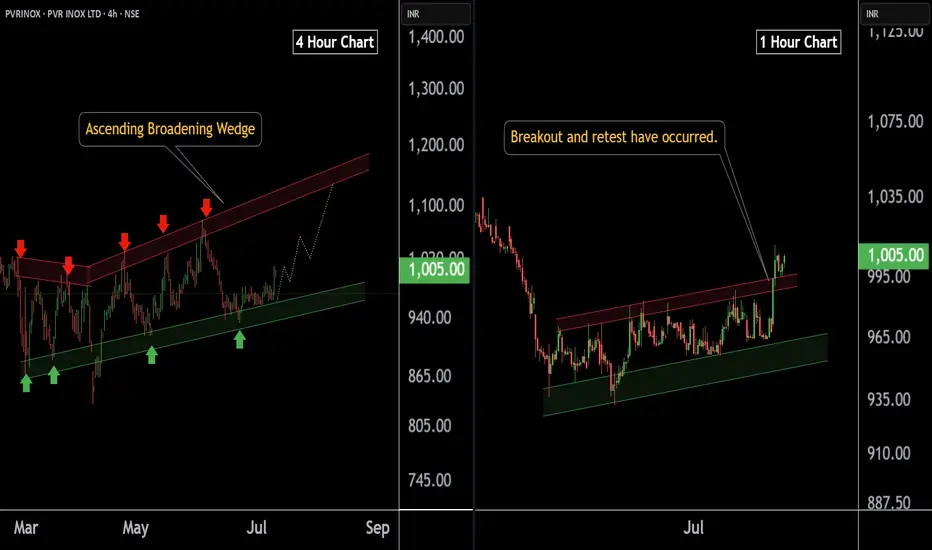
PVR INOX LTD at Best Support !! Breakout Alert !!Here are two charts of PVERINOX — one in the 4-hour timeframe and the other in the 1-hour timeframe.
4-Hour Timeframe Chart:
In the 4-hour timeframe, Power Inox is respecting its lower boundary, with a support range between 930–950.
ChatGPT said:
1-Hour Timeframe Chart:
In the 1-hour timeframe, the stock has given a breakout and has now completed a retest at 980-990 level.
If this level is sustain then , we may see higher in PVRINOX.
Thank you !!
VOLTAS In breakoutNSE:VOLTAS in breakout. As it approaches the key level of 1390, I recommend buying once it decisively crosses that threshold. With bullish momentum building, we can set our sights on the first target at 1480 and an ambitious second target at 1565!
Remember, investing requires careful analysis and risk management. Stay informed, and let’s navigate this market together! What are your thoughts? Are you eyeing VOLTAS or any other stocks for potential growth? Let’s discuss in the comments below! 💬💰 #StockMarket #InvestmentStrategy #VOLTAS #BreakoutTrading

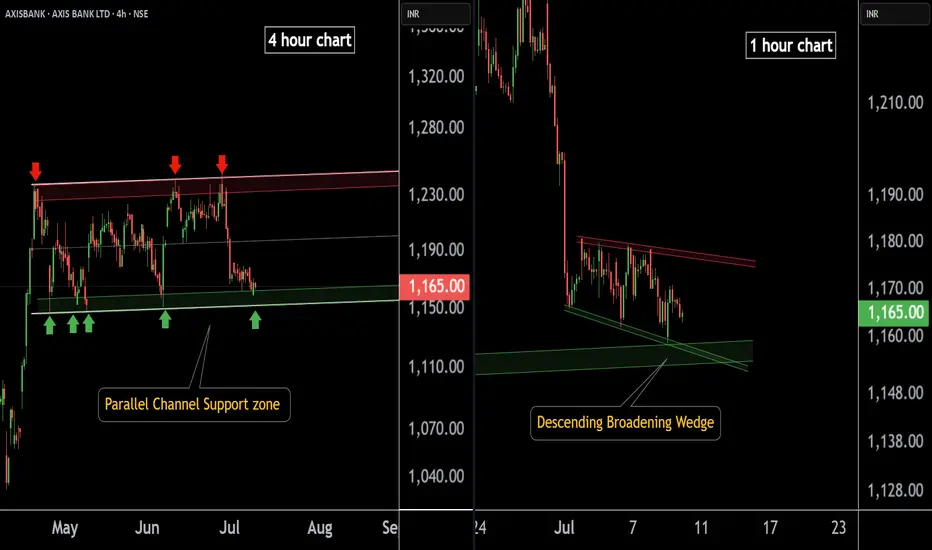
AXIS BANK at Best Support !!Here are two charts of Axis Bank — one in the 4-hour timeframe and the other in the 1-hour timeframe.
4-Hour Timeframe Chart:
In this chart, Axis Bank is moving within a parallel channel, with the support zone lying in the 1150–1160 range.
1-Hour Timeframe Chart:
Axis Bank is forming a descending broadening wedge pattern, with support near the 1150–1155 zone.
If this level is sustain ,then we may see higher prices in Axis Bank.
Thank You !!
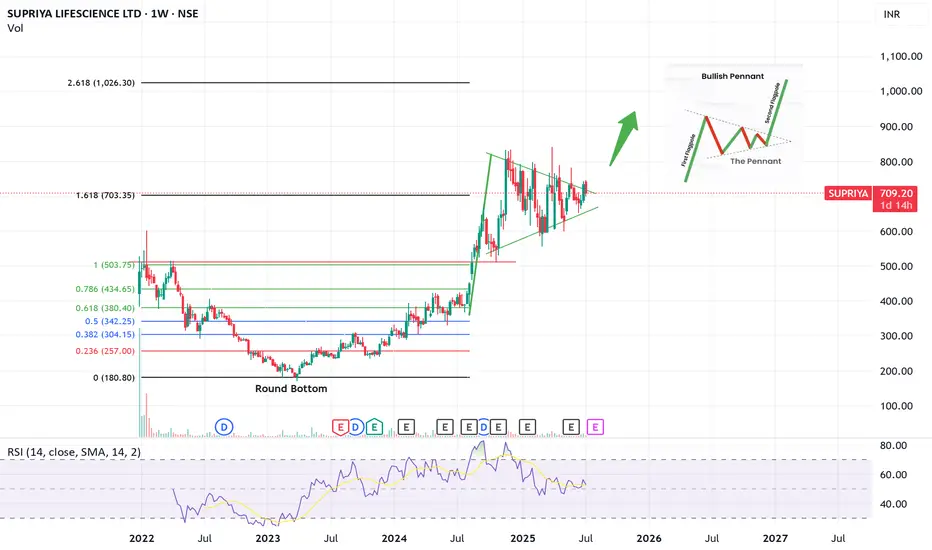
SUPRIYA! Bullish Penant. Weekly- Good company with decent fundamentals
- Bullish Penant visible. Need Breakout confirmation
- A little more consolidation possible
This is not a buy/sell advice. Only for educational purposes