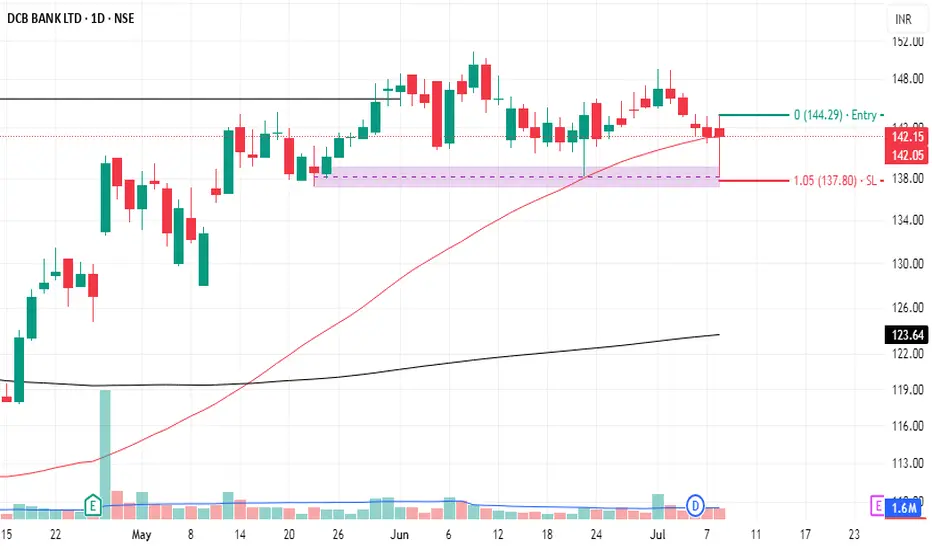
DCB BANK -fundamentally attractive and looking goodDCB Bank is fundamentally attractive value‑wise: strongly capitalized, efficient, and profitable, yet deeply undervalued. However, potential risks include credit quality and low free cash flows.
Stock has found support from medium-term moving averages.
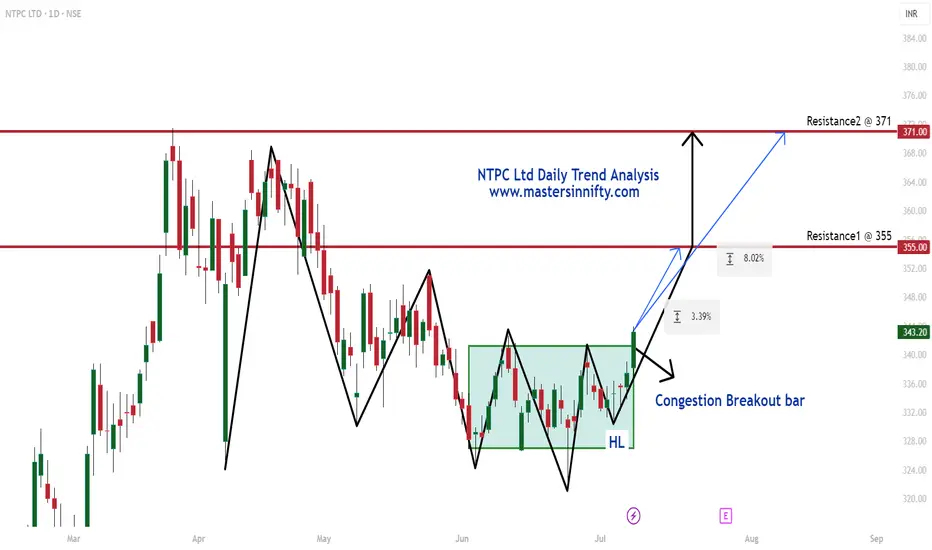
NTPC Daily Trend AnalysisNTPC Ltd has broken out of a 24-bar range, formed a new higher low, and closed above the range today.
This breakout signals a potential bullish trend over the next 7 trading sessions, with an initial target of ₹355. If the price sustains above ₹355, it may advance toward the next key resistance level at ₹371.
This is my personal view and not a buy or sell recommendation. Traders are encouraged to perform their own technical analysis before taking any trading decisions.
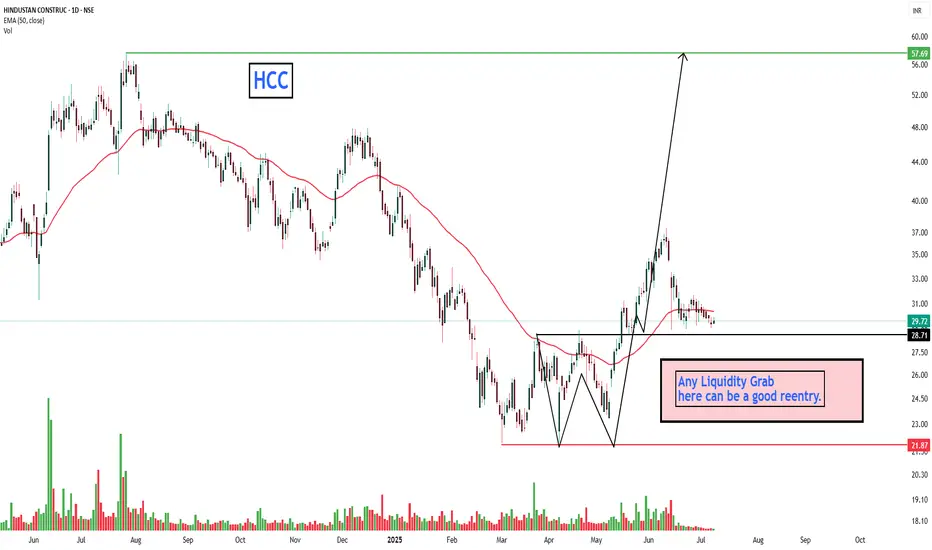
HCC LOOKING - COULD BE A GOOD ENTRYEverything is pretty much explained in the picture itself.
I am Abhishek Srivastava | SEBI-Certified Research and Equity Derivative Analyst from Delhi with 4+ years of experience.
I focus on simplifying equity markets through technical analysis. On Trading View, I share easy-to-understand insights to help traders and investors make better decisions.
Kindly check my older shared stock results on my profile to make a firm decision to invest in this.
Kindly dm for further assistance it is for free just for this stock.
Thank you and invest wisely.
Nykaa BuyNykaa stock (FSN e-Commerce) is taking support at trend line. Buy @CMP (203) with SL of 195 and target of 210 and 230.

VBL Short_Rejection @ 20 DEMAVBL Short:
- Price Rejection @ 20 DEMA
- Enter Short when price is favorable in lower timeframe
- SL: Close above 20 DEMA

VEDL Long_Support @ 20 DEMAVEDL Long:
- Price support @ 20 DEMA
- Enter when prices are favorable
-SL: Close below 20 DEMA

DLF Long_Support @ 20 DEMADLF Long:
- Price support @ 20 DEMA
- Bullish Engulfing candle.
- Enter long when the price is favorable in the lower timeframe
- SL: Close below 20 DEMA

HDFC AMC Long_ Support @ 20 DEMAHDFC AMC Long:
-Price takes support @ 20 DEMA
- Good Volume
- Enter long when the price is favorable in the lower time frame
- SL: Close below 20 DEMA


DIXON techno-funda analysisDixon Technologies is one of India’s largest electronics manufacturing services (EMS) companies, operating across mobile phones, TVs, lighting, wearables, and security systems. With significant capacity, backward integration, and multiple PLI-linked verticals, it serves global brands under a B2B model. The stock is currently trading at ₹15,473.00 and is showing signs of trend continuation after a shallow retracement.
Dixon Technologies – FY22–FY25 Snapshot
Sales – ₹10,700 Cr → ₹12,900 Cr → ₹14,800 Cr → ₹16,900 Cr – Strong growth led by capacity and client expansion
Net Profit – ₹190 Cr → ₹260 Cr → ₹318 Cr → ₹410 Cr – Improving margins and operating leverage at scale
Order Book – Strong → Strong → Strong → Strong – Visibility from anchor clients and PLI-backed segments
Dividend Yield (%) – 0.07% → 0.09% → 0.10% → 0.11% – Nominal, reinvestment-led growth focus
Operating Performance – Moderate → Strong → Strong → Strong – Multi-segment margin expansion
Equity Capital – ₹11.88 Cr (constant) – Lean and efficient equity structure
Total Debt – ₹130 Cr → ₹110 Cr → ₹95 Cr → ₹85 Cr – Well-managed debt, low leverage
Total Liabilities – ₹1,540 Cr → ₹1,650 Cr → ₹1,760 Cr → ₹1,870 Cr – Aligned with scale and vertical integration
Fixed Assets – ₹640 Cr → ₹715 Cr → ₹810 Cr → ₹905 Cr – Ongoing capex into backward integration
Latest Highlights
FY25 net profit rose 28.9% YoY to ₹410 Cr; revenue rose 14.2% to ₹16,900 Cr
EPS: ₹68.96 | EBITDA Margin: 6.8% | Net Margin: 2.43%
Return on Equity: 21.75% | Return on Assets: 10.52%
Promoter holding: 33.43% | Dividend Yield: 0.11%
Expansion in wearables, laptops, and tablet manufacturing under new PLI approvals
Capacity ramp-up ongoing across camera modules, motherboard assembly, and battery packs
Technical Snapshot Dixon is trading at ₹15,473.00 with an RSI of 53.99, indicating balanced momentum with signs of bullish continuation. The price has bounced from point ‘c’ on the Fibonacci retracement structure, with three mapped upside targets at ₹17,473.05, ₹18,905.90, and ₹20,731.10. Volume activity has been steady, supporting the case for trend extension as long as the breakout holds above the neckline.
Business Growth Verdict Yes, Dixon Technologies continues to execute across high-growth verticals
Strong earnings expansion supported by deeper client wallet share
Capital allocation focused on automation, scale, and cost optimization
Multi-sector visibility with long-term PLI tailwinds intact
Final Investment Verdict Dixon Technologies remains a leading proxy for India’s electronics manufacturing ambitions. Its B2B partnerships with global brands, focus on vertical integration, and capacity-driven margin expansion enable sustainable growth. The stock is positioned for a potential re-rating if execution aligns with new PLI-led volumes. While valuations are rich, consistent delivery across product categories and financial strength makes this a strategic long-term compounder for those seeking high-RoE industrial growth exposure.

MANGALORE REFINERY & PETROCHEM 'S KEY LEVEL !! BREAKOUT !!This is the 4 hour chart of MRPL.
MRPL having a good law of polarity at 145 range.
MRPL is trading within a well-defined parallel channel, with support in the 135–140 range.
If this level is sustain , then we may see higher prices in MRPL .
THANK YOU !!

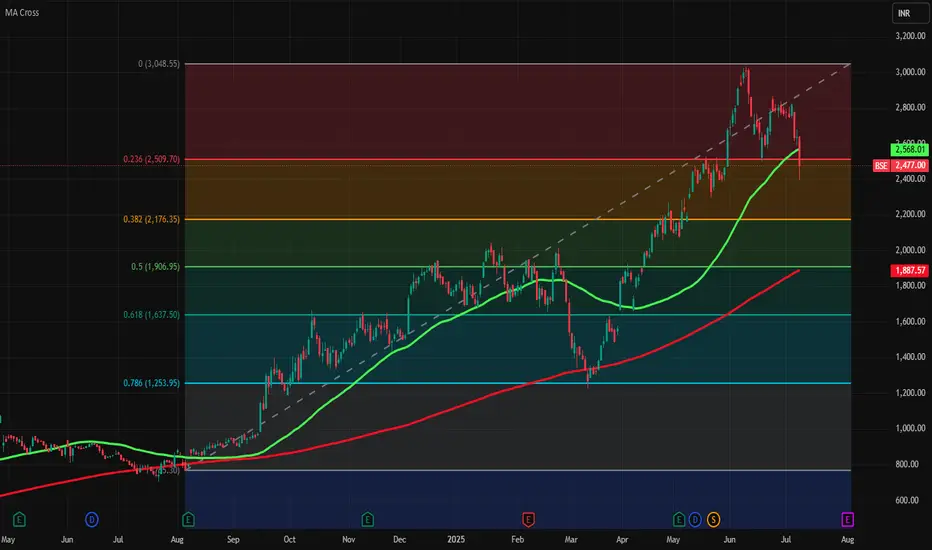
Fresh buying and selling entry in BSEAs we can watch it is falling 50 days moving average (green line) and fall from its support of 2509 and currently selling entry is possible in it till 2176.35 and if it more fall the next level of support is 1907.
Fresh buying is possible at near 2176.35 level and SL is 1907 and TPs are 2509 and 3048.
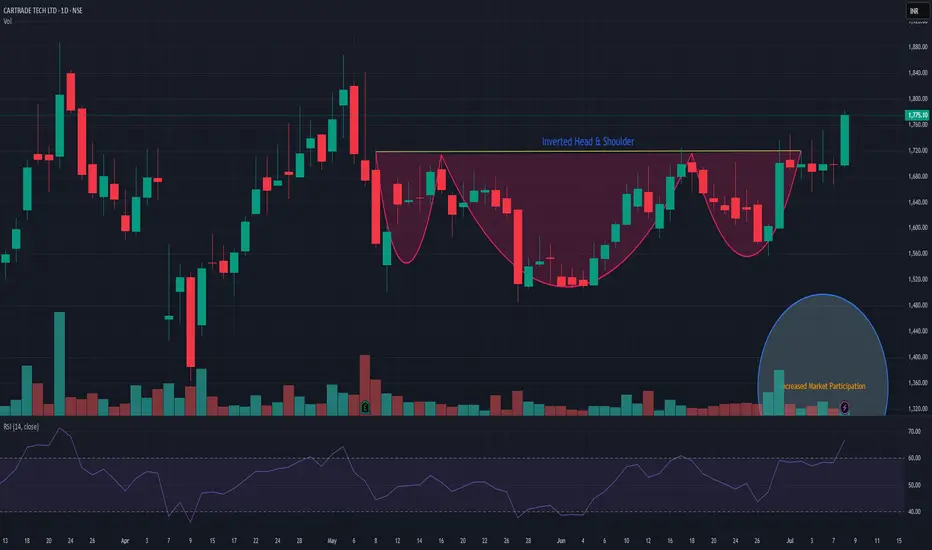
CARTRADE - Ready for its next leg upAfter setting up a nice base, CarTrade is finally looking to move up. Good consolidation in the last few months. Breakout looks clean and the volumes are excellent too!
SL - 1650

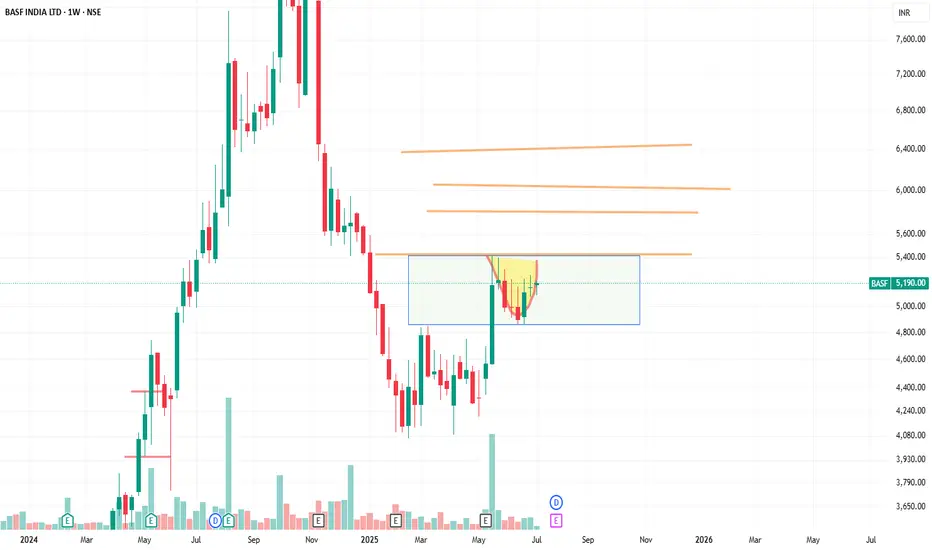
BASF India LtdThe stock has been in a long-term consolidation zone, building strong base structure.
And after a breakout retracement is going on
Now it's showing signs of breaking out with solid volume, signaling potential shift in momentum.
🧱 Base formation = strength
🔥 Volume spike = interest returning
📈 Breakout here could lead to sustained upside if momentum follows through.
Level to watch:
Not financial advice – just sharing my view.
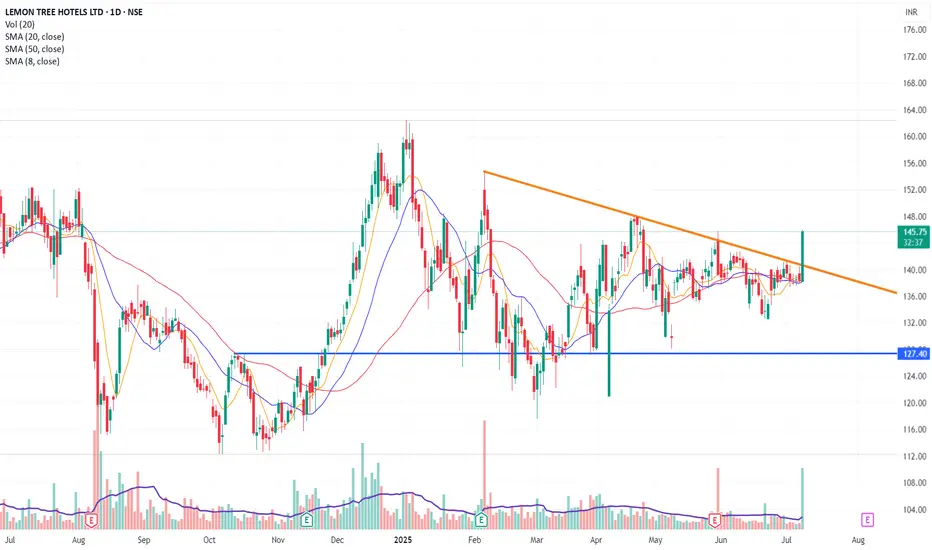
LEMON TREE – TRENDLINE BREAKOUT!
After a prolonged consolidation phase beneath the trendline, Lemon Tree has finally broken out with strong volumes, setting the stage for a potential upside move.
🔹 The breakout, backed by high participation, signals a possible shift in momentum and fresh buying interest.
This setup could offer a favourable risk–reward opportunity for short-term traders.
📌 Disclaimer: All insights shared are meant solely for educational and guidance purposes. Please consult your financial advisor before making any investment decisions. ⚠️
BHARTI HEXACOM LTD S/RSupport and Resistance Levels:
Support Levels: These are price points (green line/shade) where a downward trend may be halted due to a concentration of buying interest. Imagine them as a safety net where buyers step in, preventing further decline.
Resistance Levels: Conversely, resistance levels (red line/shade) are where upward trends might stall due to increased selling interest. They act like a ceiling where sellers come in to push prices down.
Breakouts:
Bullish Breakout: When the price moves above resistance, it often indicates strong buying interest and the potential for a continued uptrend. Traders may view this as a signal to buy or hold.
Bearish Breakout: When the price falls below support, it can signal strong selling interest and the potential for a continued downtrend. Traders might see this as a cue to sell or avoid buying.
MA Ribbon (EMA 20, EMA 50, EMA 100, EMA 200) :
Above EMA: If the stock price is above the EMA, it suggests a potential uptrend or bullish momentum.
Below EMA: If the stock price is below the EMA, it indicates a potential downtrend or bearish momentum.
Trendline: A trendline is a straight line drawn on a chart to represent the general direction of a data point set.
Uptrend Line: Drawn by connecting the lows in an upward trend. Indicates that the price is moving higher over time. Acts as a support level, where prices tend to bounce upward.
Downtrend Line: Drawn by connecting the highs in a downward trend. Indicates that the price is moving lower over time. It acts as a resistance level, where prices tend to drop.
Disclaimer:
I am not a SEBI registered. The information provided here is for learning purposes only and should not be interpreted as financial advice. Consider the broader market context and consult with a qualified financial advisor before making investment decisions.

SCHLOSS BANGALORE LTD/THE LEELA S/RSupport and Resistance Levels:
Support Levels: These are price points (green line/shade) where a downward trend may be halted due to a concentration of buying interest. Imagine them as a safety net where buyers step in, preventing further decline.
Resistance Levels: Conversely, resistance levels (red line/shade) are where upward trends might stall due to increased selling interest. They act like a ceiling where sellers come in to push prices down.
Breakouts:
Bullish Breakout: When the price moves above resistance, it often indicates strong buying interest and the potential for a continued uptrend. Traders may view this as a signal to buy or hold.
Bearish Breakout: When the price falls below support, it can signal strong selling interest and the potential for a continued downtrend. Traders might see this as a cue to sell or avoid buying.
MA Ribbon (EMA 20, EMA 50, EMA 100, EMA 200) :
Above EMA: If the stock price is above the EMA, it suggests a potential uptrend or bullish momentum.
Below EMA: If the stock price is below the EMA, it indicates a potential downtrend or bearish momentum.
Trendline: A trendline is a straight line drawn on a chart to represent the general direction of a data point set.
Uptrend Line: Drawn by connecting the lows in an upward trend. Indicates that the price is moving higher over time. Acts as a support level, where prices tend to bounce upward.
Downtrend Line: Drawn by connecting the highs in a downward trend. Indicates that the price is moving lower over time. It acts as a resistance level, where prices tend to drop.
Disclaimer:
I am not a SEBI registered. The information provided here is for learning purposes only and should not be interpreted as financial advice. Consider the broader market context and consult with a qualified financial advisor before making investment decisions.

Angel One has a buying range between 2252 and 2400,Angel One has a buying range between 2252 and 2400, with a target of 3400.
This looks like a good buying opportunity from this range

breaking soon Stock breakout patterns occur when a stock's price moves beyond a defined support or resistance level, often with increased trading volume, signaling a potential shift in market sentiment and a possible continuation of the existing trend or the start of a new one
CARTRADECARTRADe is showing strength and has given Inverted head & Shoulder breakout with decent market participation. support is near 1620. It has a potential to go up! Keep it on radar. Closing below 1620 may change my view.
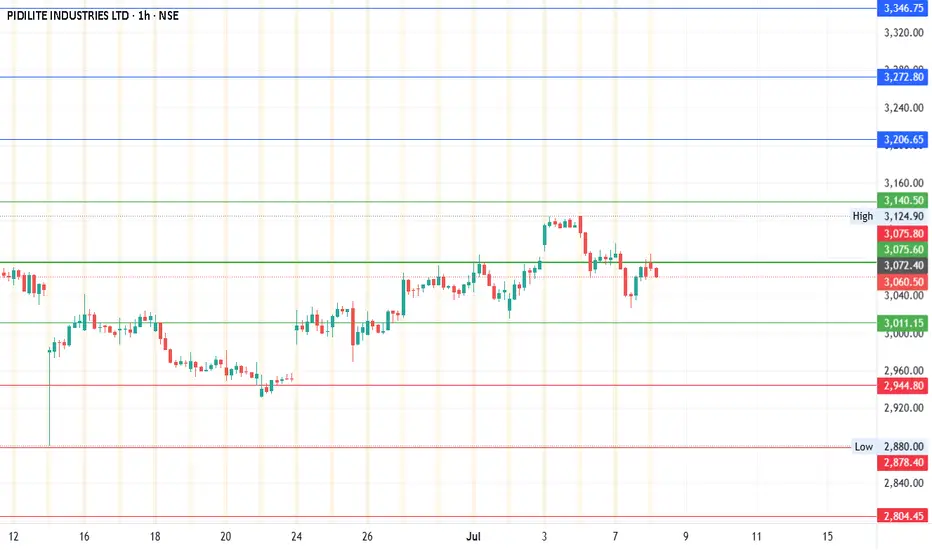
#PIDILITINDDate: 08-07-2025
#PIDILITIND Current Price: 3066
Pivot Point: 3075.60 Support: 3011.17 Resistance: 3140.52
#PIDILITIND Upside Targets:
Target 1: 3206.66
Target 2: 3272.80
Target 3: 3346.75
#PIDILITIND Downside Targets:
Target 1: 2944.78
Target 2: 2878.40
Target 3: 2804.45
VIBHOR STEEL TUBES LTD S/RSupport and Resistance Levels:
Support Levels: These are price points (green line/shade) where a downward trend may be halted due to a concentration of buying interest. Imagine them as a safety net where buyers step in, preventing further decline.
Resistance Levels: Conversely, resistance levels (red line/shade) are where upward trends might stall due to increased selling interest. They act like a ceiling where sellers come in to push prices down.
Breakouts:
Bullish Breakout: When the price moves above resistance, it often indicates strong buying interest and the potential for a continued uptrend. Traders may view this as a signal to buy or hold.
Bearish Breakout: When the price falls below support, it can signal strong selling interest and the potential for a continued downtrend. Traders might see this as a cue to sell or avoid buying.
MA Ribbon (EMA 20, EMA 50, EMA 100, EMA 200) :
Above EMA: If the stock price is above the EMA, it suggests a potential uptrend or bullish momentum.
Below EMA: If the stock price is below the EMA, it indicates a potential downtrend or bearish momentum.
Trendline: A trendline is a straight line drawn on a chart to represent the general direction of a data point set.
Uptrend Line: Drawn by connecting the lows in an upward trend. Indicates that the price is moving higher over time. Acts as a support level, where prices tend to bounce upward.
Downtrend Line: Drawn by connecting the highs in a downward trend. Indicates that the price is moving lower over time. It acts as a resistance level, where prices tend to drop.
Disclaimer:
I am not a SEBI registered. The information provided here is for learning purposes only and should not be interpreted as financial advice. Consider the broader market context and consult with a qualified financial advisor before making investment decisions.

#TITAN Equilibrium ( DEMAND AND SUPPLY ZONE)Entry Rules:
Demand Zone Buy:
Wait for price to return to a demand zone.
Look for bullish reversal candlestick patterns (e.g., hammer, engulfing).
Enter long with a stop-loss below the zone.
Supply Zone Sell:
Wait for price to return to a supply zone.
Look for bearish reversal candlestick patterns (e.g., shooting star, bearish engulfing).
Enter short with a stop-loss above the zone.
Exit Rules:
Take profit at the next key supply/demand zone or using a risk-reward ratio (1:2 or 1:3).
Trail stop-loss if price moves favorably.
