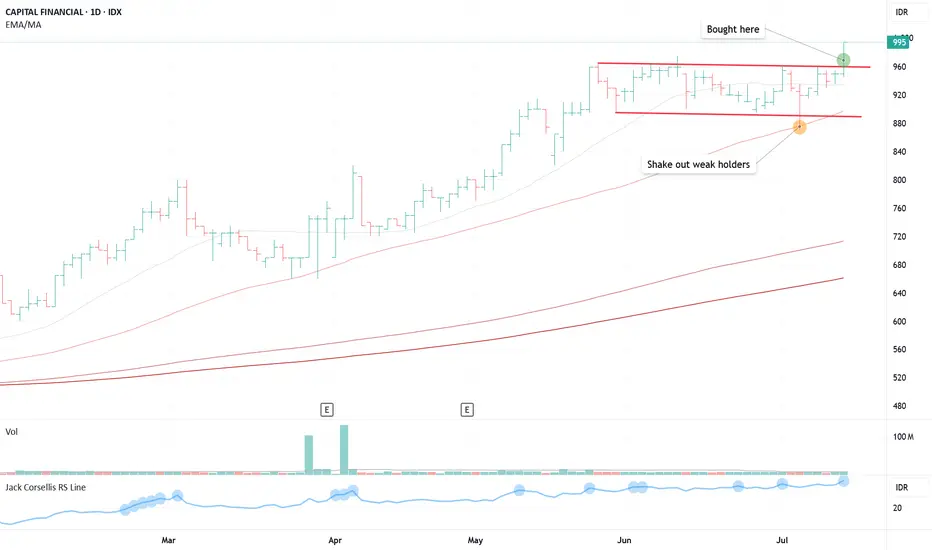
CASA - FLAT BASEPosition update: July 10, 2025.
Key factors:
1. Confirmed stage 2 uptrend.
2. A textbook Flat Base with a clear, low-risk entry.
3. The base has VCP characteristics.
4. The stock moves on its own drummer, hitting an all-time high while the index struggles to reclaim its highs.
5. A shakeout that weed out weak holders has strengthen the setup properly.
6. Volume has dried up, indicating less supply coming to the market.
7. Strong fundamentals, with consistent increased in year-over-year earnings growth.
Consideration: The breakout was not accompanied by a significant volume surge.
This is a classic Flat formation or Darvas Box Theory with a clear pivot entry and minimal risk. I’m starting to see increased traction in my personal trades—a very positive sign to trade larger in this market environment.
TLKMDISCLAMER !!!!
Telkom is already in the support area and will start to rise to a target of 3,430-3,600
SL 2.700

JPFADISCLAMER !!!!
buy 1.710 and sl 1.400-1.420
tp1 2.140
If there is a breakout, you can hold until the next target price is 2,930.

BBRI BULLISH ?? 5 WAVE ANALISYS Just my own idea for BBRI in the futures years (Weekly Candle)
Analisys with 5 wave teory from Eliot Waves.
who knows what happened?

$DEWA (VCP - 6W 19/6 3T)Position update: July 21, 2025.
Key factors:
1. Confirmed stage 2 uptrend.
2. A textbook Volatility Contraction Pattern (VCP) with a clearly defined, low-risk entry point.
3.Currently forming a VCP following a prior price surge of nearly 150%, demonstrating strong momentum.
4. The stock moves on its own drummer, rallying close to 150% while the broader market advanced just 23%.
5. Displays high relative strength, outperforming sector and index benchmarks.
6. Volume has dried up, indicating less supply coming to the market.
7. Significant volume expansion on the breakout.
Considerations: Despite a favorable technical setup, risk should be managed diligently given the stock's sharp ascent and potential for profit-taking. Establishing stop-loss levels and monitoring market conditions is essential.
This is another quintessential VCP breakout with a clear pivot entry and minimal risk. I’m starting to see increased traction in the market now—a very positive sign to scale up trading size.
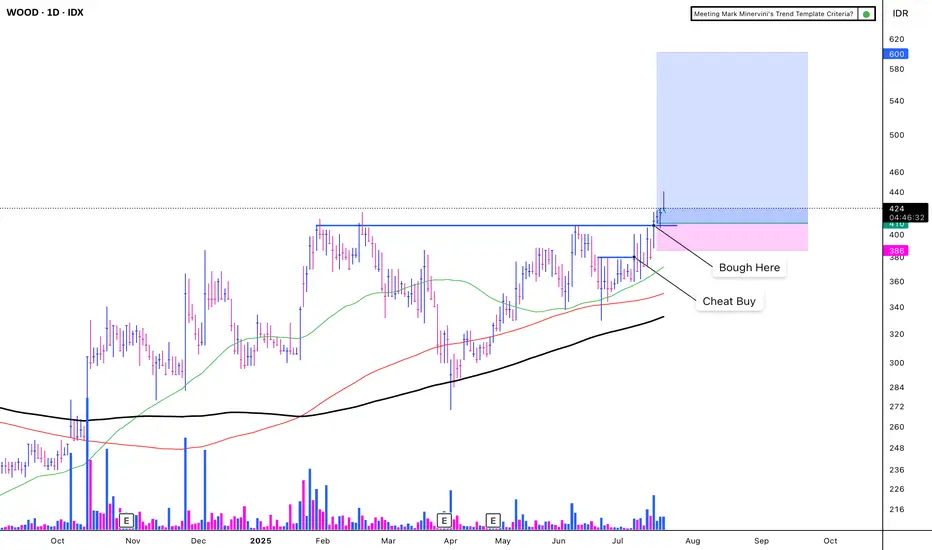
WOOD - CUP WITH HANDLEIDX:WOOD - CUP WITH HANDLE
(+):
1. Low risk entry point
2. Volume dries up.
3. Price has been above the MA 50 for over 10 weeks, with values exceeding 150, 200, and 300.
4. Price is within 25% of its 52-week high.
5. Price is over 30% of its 52-week low.
6. The 200-day MA has been trending upwards for over a month.
7. The RS Rating is above 70 (85).
8. Carbon sales increase 503%
9. Price breakout with VCP criteria
EPS Growth:
a. Quarterly QoQ: -13.24%.
b. Quarterly YoY: +68.81%.
c. TTM YoY: +49.09%.
d. Annual YoY: +33.27%.
(-)
Trump Implements a 32% Increase in Tariffs on Indonesia
The market is volatile due to the ongoing war
GOTO With news speculating around a possible merger between GOTO and GRAB, there might be some good news for the stocks as well. We’ve got an Inverted Head and Shoulders pattern forming here, and we might expect a bounce back as we re-enter the testing zone. But we need to be cautious at the support level if it breaks down, the reversal fails.
#FREEBANDZ #NOTAFINANCIALADVICE

ANJT - POWER PLAYPosition Update: May 6, 2025
Key factors:
1. Low-risk entry point.
2. It has a very tight correction area.
3. A strong sign of continuation of upward momentum.
4. Corrects below 4% during this pause, indicating big institutions' reluctance to sell their positions.
5. High relative strength, outperforming the general market.
5. The stock is moving on its own universe and marching to its own drummer.
6. Volume diminishes during the correction, indicating less supply coming to the market.
7. The general market is in the early stages of a bull campaign.
8. Huge volume on the breakout
Consideration: Not many traction in the market so far.
This is a classic Power Play setup, featuring two viable entry points. My initial position was taken on April 14 from the low cheat and added big on a very clear pivot point today. I’m looking forward to seeing further constructive price action moving forward.

TAPG (VCP 10W 18/4 3T)Position update: July 9, 2025.
Key factors:
1. Confirmed stage 2 uptrend.
2. A textbook VCP setup with a clear, low-risk entry
3. Has absorbed its majority line of supply.
4. The stock moves on its own drummer, hitting an all-time high while the index struggles to reclaim its highs.
5. High relative strength.
6. Volume has dried up, indicating less supply coming to the market.
7. Strong fundamentals, with consistent triple-digit year-over-year earnings growth.
8. Significant volume surge on the breakout.
Considerations: Despite a favorable technical setup, risk should be managed diligently given the stock's sharp ascent and potential for profit-taking. Establishing stop-loss levels and monitoring market conditions is essential.
This is a quintessential VCP breakout with a clear pivot entry and minimal risk. I’m starting to see increased traction in the market now—a very positive sign to scale up trading size.
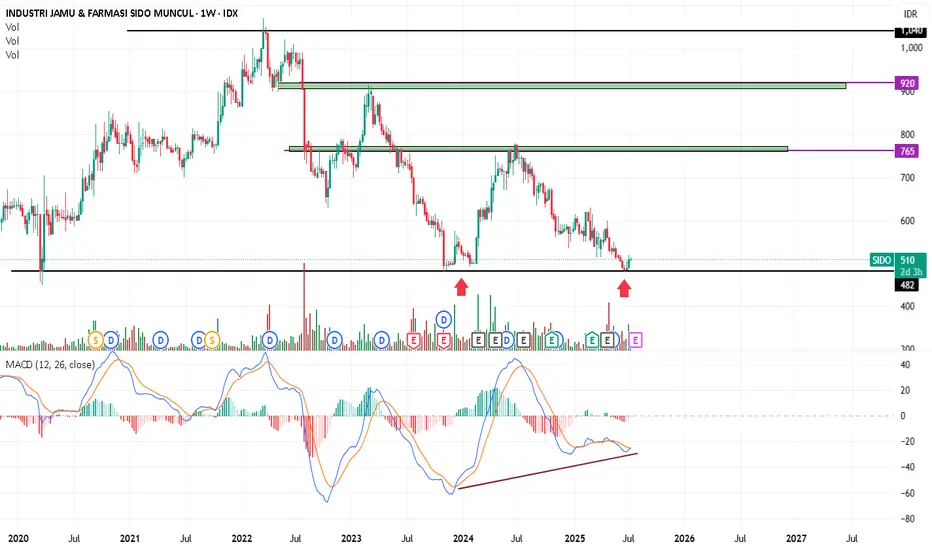
sidoDISCLAMER !!!!
You can buy now with a stop-loss of 480.
Divergence is likely.
Medium-term hold.
TP1: 765
TP2: 920
NCKLDISCLAMER !!!
You can buy now with a stop-loss below 585. If the line breaks out and becomes an uptrend, you can buy again, but you must wait for a true breakout of 760 and re-enter at 690-720.
The target is around 1,000. You can hold for the medium term, or even longer term, possibly above 1,000.
You can also take a 50% profit if the target price reaches 1,000.
I published my idea because I only remember myself, so I don't invite you to buy it.
And I also want to help all my friends, hopefully everyone will profit and be useful.

Issp sesuai garisISSP, in English, can refer to several things, but the most common are the International Social Survey Programme and the Information Systems Security Policy. It can also refer to the International Society of Sustainability Professionals or the Integrated Soldier System Project.
Here's a breakdown of the most relevant meanings:
1. International Social Survey Programme (ISSP):
This is a continuing annual program of cross-national collaboration on surveys covering topics important for social science research.
It involves various countries conducting surveys on social attitudes and behaviors.
The ISSP website provides more information about its organization, history, and member states.
For example, the ISSP has conducted surveys on topics like Work Orientations, Citizenship, and Social Inequality.
2. Information Systems Security Policy (ISSP):
This refers to a formal document outlining the security principles, procedures, and controls to protect an organization's data and IT assets.
It establishes a framework for managing information security by identifying risks, defining responsibilities, and specifying security measures.
Tenacy's website provides a guide to understanding and implementing an ISSP.
An ISSP aligns with standards like ISO 27001.
Fleet.co provides guidance on crafting an Information Systems Security Policy.
Movement will be same as trendline.
ANTM - IDX outlookANTM shares have very good fundamentals. The current price is wrong because there are many issues that hit ANTM, such as the issue of 109 tons of gold which was thought to be fake gold, as well as the issue of Budi Said regarding demands for 1.1 tons of gold which was ultimately proven by Budi Said to be guilty and to have carried out a fake transaction with one of ANTM's marketers. These 2 sentiments have weighed on ANTM for more than 1 year.
However, judging from the company's fundamentals, Antam's Q1 had a major correction because ANTM expanded its mining and nickel projects. Apart from that, nickel prices are also putting pressure on ANTM because there is still a correction in nickel commodity prices.
ANTM still has very good company fundamentals
Why?
1. ANTM through Inalum and MIND ID base owns 51% of Freeport shares, and Freeport is the largest gold mine in the world.
2. The completion of the case of 109 tons of ANTM gold, which many thought was fake, will restore public confidence in ANTM investors.
3. We can feel that we will now enter a recovery phase for all countries after the tough years of 2020 to 2023. 2024 will be a little more stagnant because of the many presidential elections in various countries which makes investors choose to wait and put more money into bonds and deposit.
4. Recovery of nickel prices and other minerals caused by demand due to the race for progress and ESG will benefit ANTM
5. The price of gold is consolidating again to reach an all time high, especially as the FED and other countries may reduce interest rates, this will make the gold price likely to decrease its all time high around 2600-3000 in 2025-2026
Antm price target for the next 1 year: IDR 2400 -2600
Target price for Antam for the next 3 years = IDR 4200- 5500
if you want to discuss with me or my team. please comment below.

TAPG - VCP (11W 18/4 3T)IDX:TAPG - VCP
(+):
1. Low risk entry point on a pivot level.
2. Volume dries up.
3. Price has been above the MA 50 for over 10 weeks, with values exceeding 150, 200, and 300.
4. Price is within 25% of its 52-week high.
5. Price is over 30% of its 52-week low.
6. The 200-day MA has been trending upwards for over a month.
7. The RS Rating is above 70 (86).
8. There has been a significant breakout with substantial volume
**EPS Growth:**
a. Quarterly QoQ: -46.42%.
b. Quarterly YoY: +117.27%.
c. TTM YoY: +111.05%.
d. Annual YoY: +94.02%.
(-)
1. Trump Implements a 32% Increase in Tariffs on Indonesia
2. The market is volatile due to the ongoing war

DKFT - POWER PLAYIDX:DKFT - POWER PLAY
(+)
1. Low risk entry point on a pivot level.
2. Volume dries up.
3. Price has been above the MA 50 for over 10 weeks, with values exceeding 150, 200, and 300.
4. Price is within 25% of its 52-week high.
5. Price is over 30% of its 52-week low.
6. The 200-day MA has been trending upwards for over a month.
7. The RS Rating is above 70 (98).
8. There has been a significant breakout with substantial volume with VCP There has been a significant breakout with substantial volume, with VCP characteristic.
9. The price shoot up by 102% and paused only for 18%, indicating a strong uptrend
**EPS Growth:**
a. Quarterly QoQ: +79.70%.
b. Quarterly YoY: +819.89%.
c. TTM YoY: +356.12%.
d. Annual YoY: +484.31%.
(-)
1. Trump Implements a 32% Increase in Tariffs on Indonesia
2. The market is volatile due to the ongoing war


Saham PTBA: Tunggu Sinyal lenkap dgn 5 Peluru📊 Stock Analysis of PTBA Bukit Asam Tbk. using Profitmore Trade™'s 5 Bullets Strategy:
🔹 1. Zero Line
🔹 2. AO Divergence
🔹 3. SQUAT
🔹 4. Fractal
🔹 5. Momentum
🔍 Market Segmentation Analysis:
📅 Monthly: Even segment
📅 Weekly: 8 even segments (Monthly timeframe)
📅 Daily: Corrective even segment (2 waves) after a bearish odd segment
⚠️ Not Yet Time to Enter! The 5 Bullets signals are not yet complete. Wait ~2 weeks for confirmation of optimal entry conditions.
📌 Odd & Even Segment Theory: Even segments typically last as long as or longer than odd segments. Monitor the market closely!
#ProfitmoreTrade #StockAnalysis #PTBA #TradingView #TechnicalAnalysis #IndonesianStocks

ERAA: Cup and Handle Pattern with Momentum to BullishSince 2021 and back to that year, ERAA's stock price has fallen from 720 to 320 (Feb-25), however on May-25, ERAA managed to break the channel trend and continues trading above the channel trend (440).
ERAA is now trading at 0.382 (478) and 0.5 (525) fibo, capturing cup and handle form. As traders, we should wait and observe if the price is still trading in the area between (478-525). Any advance over the 525 level indicates that bullish momentum remains in place. Otherwise, we should wait and see if the price retests fibo 0.382 (478) or not.
Disclaimer: The information is not an investment advice and does not constitute any offer or solicitation to subscribe or redeem. Users are advised to peruse the articles and other data in the website only as information and to rely on their own judgment when making investment decisions.

BNLI - VCP (11W 21/4 3T)IDX:BNLI - VCP
(+)
1. Low risk entry point on a pivot level.
2. Volume dries up.
3. Price has been above the MA 50 for over 10 weeks, with values exceeding 150, 200, and 300.
4. Price is within 25% of its 52-week high.
5. Price is over 30% of its 52-week low.
6. The 200-day MA has been trending upwards for over a month.
7. The RS Rating is above 70 (98).
8. There has been a significant breakout with substantial volume.
9. The price surged up by 150% and paused only for 24%, indicating a strong uptrend.
10. The stock is the leader of its sector.
**EPS Growth:**
a. Quarterly QoQ: +0.96%.
b. Quarterly YoY: -2.27%.
c. TTM YoY: +34.60%.
d. Annual YoY: +38.06%.
(-)
1. The major market is focused on Danantara and Hilirisasi stocks.

SCMA offers good R:R from this levelPrice is completing its ABC correction and right now attached exactly at the 78.6% fibo level.
After ABC correction is complete, next bullish move should aim to 330-350, minimum target is closing the GAP at 200-210.

TRUK - VCP (118W 66/27 3T)IDX:TRUK - VCP
(+):
1. Low risk entry point on pivot level
2. Volume dries up
3. Price above MA 50 > 150 > 200 over 10 weeks
4. Price is within 25% of 52 weeks high
6. Price is over 30% of 52 weeks low
7. 200 day MA trending up over 1 month
8. RS Rating is over 70 (84)
9. Breakout with huge volume
(-)
1. There is nothing good with the fundamental

BREN 20/6/25With Danantara focusing on 8 sector points, with one of them is Renewable Energy. IDX:BREN is now very interesting, with the inverted head n shoulder that gave us a reversal signal. BREN is now very cheap, as the 3rd biggest market cap on IDX. #FREEBANDZ
