ACES going to nearest Fibo target soonACES has rebounded from low to nearest fibo target soon.
Still some upside from here.

TAPG potential forming Gartley PatternWatchout TAPG for Potential Gartley Pattern completion. If you believe Gartley pattern completion is possible, there is plenty upside from here.

SMRA breakout from inverse HnS pattern.SMRA breakout from inverse HnS pattern. Still has lots of opportunity to add positions.


ADCP potential breaking downtrendADCP at the end of triangle, in my opinion adcp have fair chance to go up from here


SMRA breakout inverse HnS patternSMRA breakout HnS and has the potential to go up further from here.

BRIS breakout still with some more upside potentialBRIS has breakout with some more potential upside ot nearest resistence

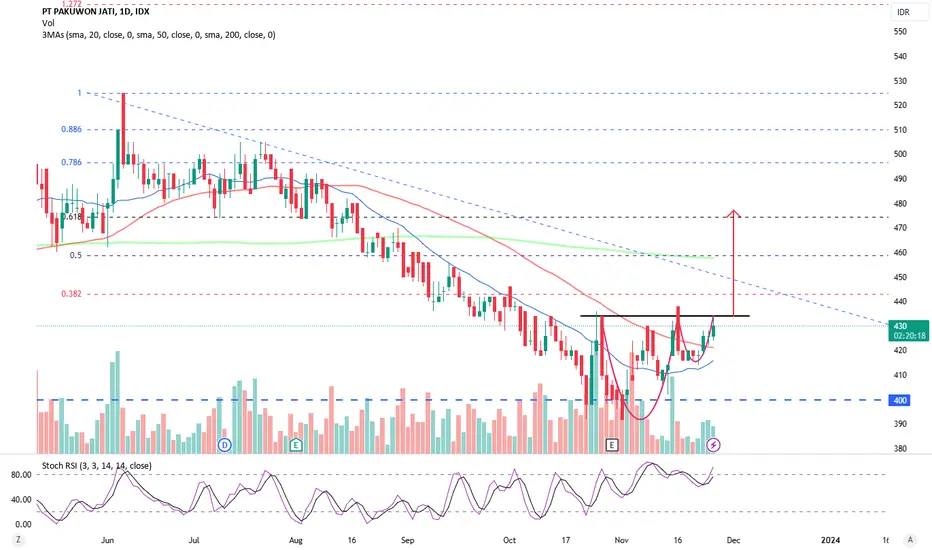
PWON potential breaking Cup and HandlePWON potential breaking Cup and Handle with target inline with 61.8 fibo retracement
BFIN probably changing from cup&handle to HnS patternAfter reaching the neckline of Cup&Handle, price going lower.
Although still very early, but hopefully price will form the HnS pattern.
Finger Crossed !

If price able to complete the Cup and Handle PatternLookout for BFIN, if price able to complete the small Cup and Handle Pattern and completes the 38 fibo retracement, hopefully price can go to next fibo retracement as target

Bearish Gartley in the making on daily and weekly timeframeSMGR developing what looks like Bearish Gartley pattern valid on both Daily and Weekly timeframe.

AUTO still going strong to complete Wave 5As stated before, AUTO will complete Wave 5 but looks like it will be much sooner than anticipated.

SMGR completed wave and in progress of ABC waveSMGR look to complete the ABC wave.
I'm not export in wave, just share my personal ideas only.
Hope it works out.

AUTO journey to complete next wave. See previous post as wellAs stated in previous posting, AUTO has completed the small wave and looking for bigger wave completion.
Still long journey but hope for the best.
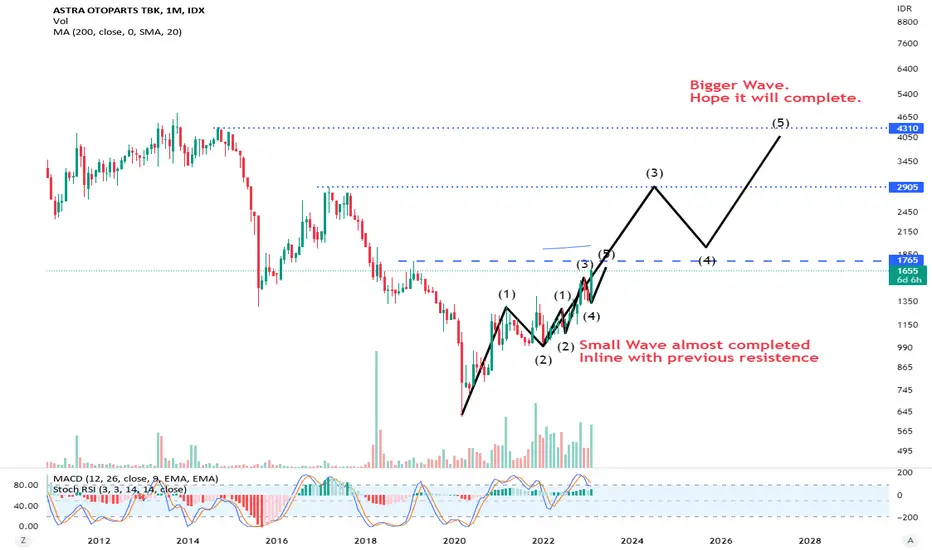
AUTO completed Small Wave, looking for next bigger waveAUTO move to complete small wave thanks to record profit announcement.
Looking for AUTO to complete next big wave. I will post the big wave in next chart

Cuan potential bearish trendPotential LH and LL in HTF. Going to bid after we make consolidation after big down


GOTO trading ideasThis is just a personal opinion, it has no purpose to encourage buying and selling, purely a personal opinion

$ADMRReady for end year rally.
ADMR looking to start wave 5 and try to break out the pattern.
The demand and price of coal probably increase in the end of the year, so this stock will probably inline to increase significantly (hope).
What do you think? Will it happen?

ERAA almost completes Bullish Gartley PatternERAA is moving down to complete Bullish Gartley Pattern.
If the pattern is completed and valid, there is potential of reversal.

BBRI : Rebound, Targeting Rp5750 pre-2024 Election VolatilityOn November 1, 2023, Bank Rakyat Indonesia (BBRI) stock exhibited a notable touch on the lower trendline at Rp4930. This technical analysis delves into the implications of this touch, marked by a bullish pattern and rapid ascent, further substantiated by the stock's position above the Exponential Moving Average (EMA) 200 and a positive MACD crossover. The objective is to explore the basis for the continuation of the upward trend with a potential target range of Rp5750 before the anticipated market volatility preceding the 2024 Indonesian elections.
Technical Analysis:
Lower Trendline Touch and Bullish Pattern:
- The touch on the lower trendline at Rp4930 signals a substantial support level, suggesting a potential trend reversal.
- The emergence of a bullish pattern reinforces the positive sentiment, indicative of a swift upward movement.
EMA 200 Position:
- The stock's positioning above the EMA 200 signifies a robust long-term momentum.
- The close proximity of the stock price to the EMA 200 provides additional confirmation of the potential for a sustained upward trend.
MACD Conditions:
- The MACD exhibits a bullish condition with a crossover of the signal line to the upside and a positive histogram.
- The bullish signal from MACD supports the notion that buyer momentum is on the rise.
Upside Target:
Upper Target (Resistance):
- Given the confirmation from the trendline, EMA 200, and MACD, the initial upside target is set around Rp5750 or higher.
- This level encapsulates potential technical resistance that the BBRI stock may encounter during its upward trajectory.
Additional Analysis:
Supplementary Indicators:
- Further confirmation from auxiliary indicators like RSI and trading volume is recommended to provide a comprehensive view of trend strength and market participation.
Market News Monitoring:
- The potential for market volatility leading up to the 2024 Indonesian elections underscores the importance of vigilantly monitoring market news and political developments.
Risk Considerations:
Stop-Loss:
- Effective risk management involves placing a stop-loss beneath the trendline or support level.
Conclusion:
In conclusion, BBRI stock presents a compelling case for a continuation of its upward trajectory, supported by the confirmation from the trendline, EMA 200, and MACD. With a potential upside target of Rp5750, investors should remain vigilant as the market navigates the uncertainties leading up to the 2024 Indonesian elections. Regularly updating analyses in response to evolving market conditions and seeking advice from financial professionals is advisable before making investment decisions.

BREN - VELOCITY PLAYI have a position
October 27, 2023
The reasons:
1. Low-risk pivot point
2. The stock offers the first buyable base after an IPO
3. It skyrockets huge >300% immediately after it went public
4. High relative strength, outperforming the general market
5. The stock is moving on its own universe, marching to its own drummer
6. Volume dries up during the pause
7. Big volume on the breakout
Flaw:
The market is still in a hard-penny environment with only 30% of total stocks above the 200-day MA.
This is a power play type of setup, where velocity begets velocity. I like to see if it can hold up and move higher from here.
