PTPP, week#37We didn't expect this great move of PTPP
As long as it didn't close below IDR655, it has potential to reach IDR820

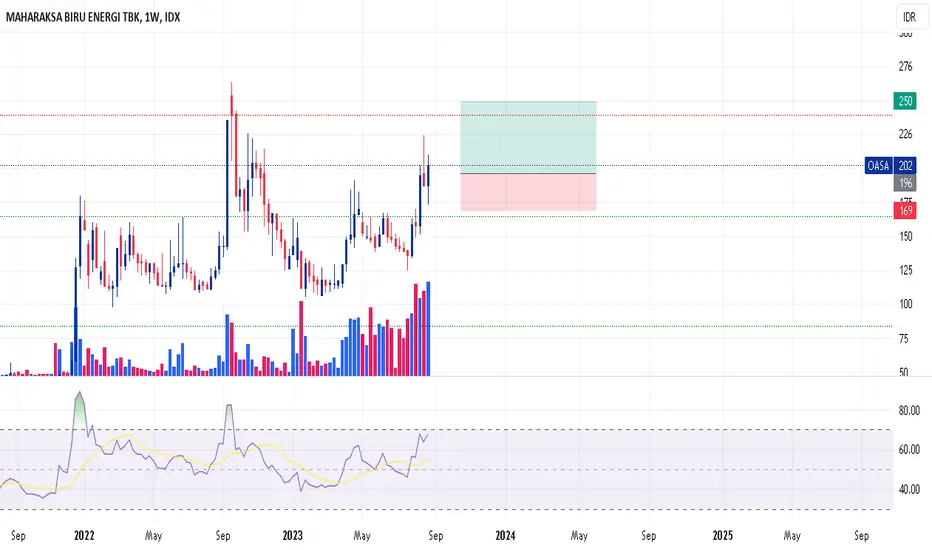
BEEF - POWER PLAYI bought my positions today
August 25, 2023
The reasons:
1. Low-risk entry point
2. The stock is up >100% in less than 8 weeks
3. Corrected the least during the pause, less than 25% correction
4. Volume dries up as a sign of less supply coming to the market
5. High alpha stock with a low standard deviation
6. It has VCP characteristics
7. Huge volume on the breakout
8. The theme: Power play. The setups work well in this current market environment
The flaw:
No identifiable flaws thus far
This is a textbook Power Play stock breaks out of a base. I like to see the stock moves constructively in the upcoming days.

KAYU - POWER PLAYI bought my positions today
July 31, 2023
The reasons:
1. Low-risk entry point
2. The stock is up >100% in less than 8 weeks
3. Corrected the least during the pause, less than 25% correction
4. Volume dries up as a sign of less supply coming to the market
5. High alpha moves with a low standard deviation
6. Power play on top of a power play
The flaw:
Lack of volume on the breakout
I like to see the stock moves constructively in the upcoming days.

INDFPattern : Head & Shoulder
Potential breakdown to 6200 level, starting downtrend which confirm by MACD (down to ZERO level)
Recommendation:
Stay away from now (since we cant short this stock at IDX)
#plan_trade_repeat

NCKLPattern : symmetrical triangle
Try to penetrate the trend line at level 985
If break, there are potential upside to 1255 level (gradually from 1020, 1075, 1155 to 1255)
MACD : try to go up to 0 level
Recommendation:
BUY: if break 985
Sell: as mentioned above
STOP loss: 3-5% from purchase price
Disclaimer:
this recommendation is made based on technical analysis, all decision to buy/sell is on traders/investors
#plan_trade_repeat

Adaro Energy Indonesia TBK. Week#36Adaro still in a great volume
Our next target is IDR2710
Support at IDR2660

AVIA- waiting for breakoutit's seen that AVIA clearly has divergence between the price and MACD
Based on experience, if a stock experience the divergence between price and some indicator (in this case is MACD), this stock will bounce back again to its level making a HH and HL
but to confirm this, we need to wait until the trend penetrates 610 level at the minimum.
patience is the key for profit =D
#plan_trade_repeat

$MTEL to 760I think MTEL is bullish because it takes sellside and provide an orderblock at weekly timeframe

AKRA break bearish trendlineCurrently, the holder was accumulated the shares. Enhance with trend of energy which tend to rise near end year, it is ideal time to start long position.

BIKE - POWER PLAYI bought my positions today
August 28, 2023
The reasons:
1. Low-risk entry point
2. The stock is up >100% in less than 8 weeks
3. Corrected the least during the pause, less than 25% correction
4. Volume dries up as a sign of less supply coming to the market
5. High alpha stock with a low standard deviation
6. A base reset to a proper and crisp pivot on PP setup
7. Huge volume on the breakout
8. The theme: Power play. The setups work well in this current market environment
The flaw:
No identifiable flaws thus far

KLBFDivergence between price and MACD
Action:
Buy - if the price break up the below band of BB at 1890 at the minimum
Sell - 2020
Stop loss - 3-5% from buy price
#Disclaimer_on : this recommendation is based on technical analysis, all buy/sell decision based on your own risk appetite