GEMS is another hidden gems?Price actions analysis
GEMS Daily time frame shown falling wedge completed, price action entering transition from bearish to bullish. Wait for another pullbacks and swing low prior enter for long.
Disclaimer ON

BBCA - Strong weekly candleBBCA finish this week with strong bullish candle and nice inflow with accumulation.
This week BBCA will face Daily key level at 9900 and potentially BBCA will turn back to Weekly key level at 9300 then bounce back to next Weekly key level 10400.
Other scenario is BBCA will break Daily Key level 9900 and hit Weekly key level at 10400 and turn back to Daily key level (Res become Support) and then continue bounce back to bullish run.
Goodluck!

CARE - Road to Bagger ?Cup and handle pattern nicely formed in Weekly timeframe and strong momentum come from stochastic. One thing that need to be considered is weekly volume is not strong enough this week.
Distance to supply zone is very high, we can setup Target at the low of Supply Zone and current candle "sit" at support area so Risk Reward become fantastic.
Hopefully next week we can have "Good" volume to push price higher and chance to be bagger will be there... Good luck!

Another bullish continuation pattern - DMMXHopefully it will fly to 494
1. RRR 1:2.4
2. Volume above average
3. Bullish continuation pattern
4. Strong Stoch Momentum signal

Waiting Break Off - DEWA1. Nice bullish flag pattern in bullish trend.
2. Volume above average vol 20 days
3. Stochastic ready for Golden Cross
4. Put Buy stop at Entry line
5. Nice Risk Reward Ratio

Ready for take off - CYBR1. Breakout Bullish Pattern with strong volume
2. Few times come and leave support area at 965-1005
3. Good Risk Reward Ratio 1:4
4. Good momentum with GC Stochastic

MEDC 14/05/25After a long weekend, there might be good news about the IHSG. While it has grown 18% over the past month, the oil sector in Indonesia still isn’t getting the love it deserves. With strong foreign accumulation, I believe IDX:MEDC might break through 1200. #FREEBANDZ

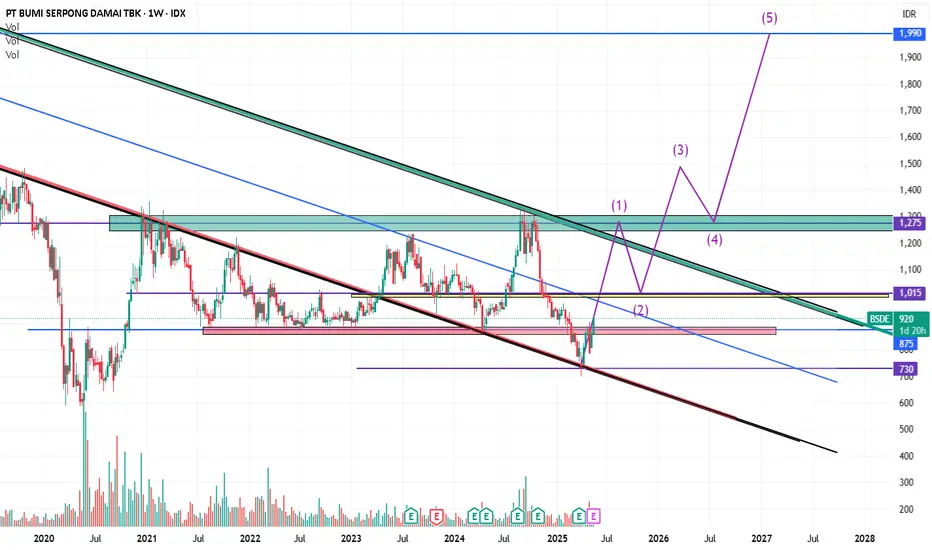
BSDEDISCLAMER!!!
untuk long trem
now price supported
sl price 860
target 1 price 1.275
target price 3 diwave 3
BBRI hakaBBRI currently at Rp 3,630 closing price 9 April 2025.
Technical :
Near on support line at Rp 3,620. Still solid this line I think.
MACD give the good sign too
Macro :
Cum Date Dividend on 10 April 2025. Dividend Rp 208,4 (5.7% from the current price).
Trump delay the tariff in 90 days ahead. ( The news )
So, it's a good news for short term period.
It will be pump hard haha.
Thankyou for reading my ideas.
DWYOR.
I hope everyone have a good health and good life!

tired of "Indonesia Common Big Bank" ? try this BNGAAfter I rebalance my portofolio and invest strategy, I turn to try "Dividen Investing" from Indonesia Stock haha
So basicly, I post this just for timing when to entry, and now is good time to entry IDX:BNGA
Fundamental Analysis:
Net Income consistent to growth year after year
"Sexy" Dividen Yield for Banking Sector
Dividen Payout Ratio (DPR) 50% on average each year. I think it's good because it sign if IDX:BNGA still have room to growth
Technical Analysis: (to know is a time to entry or not yet)
Success to break 1,785 (resistance level and this 0.5 Fib Retracement)
Huge Volume after touch the EMA 50 (Bulish Engulfing Candle appear)
Good time to have beautifull Risk&Reward set up (if you want short term)
I just entry this and hold for long time.
But, if you want short time, maybe you can try this set up
Entry : 1,785 - 1,800
TP : 2,010
SL : 1,720
Risk&Reward Ratio : 1:3.46
DYOR
This post just share my ideas, not financial advice
Thankyou for reading, and maybe good thing always come for all of us!


SAME - VCP (10W 25/5 3T)IDX:SAME - VCP
(+):
1. Low risk entry point on pivot level
2. Volume dries up
3. Price above MA 50 > 150 > 200 over 10 weeks
4. Price is within 25% of 52 weeks high
6. Price is over 30% of 52 weeks low
7. 200 day MA trending up over 1 month
8. RS Rating is over 70 (80)
9. 9. EPS Growth:
a. Quarterly QoQ: +852.30%
b. Quarterly YoY: +570.99%
b. TTM YoY: -3.34%
c. Annual YoY: -3.36%
(-)
1. Breakout with huge volume but long wick
Note: I will sell half if hit first Stop Loss, and sell remaining on the last stop loss on first cheat buy

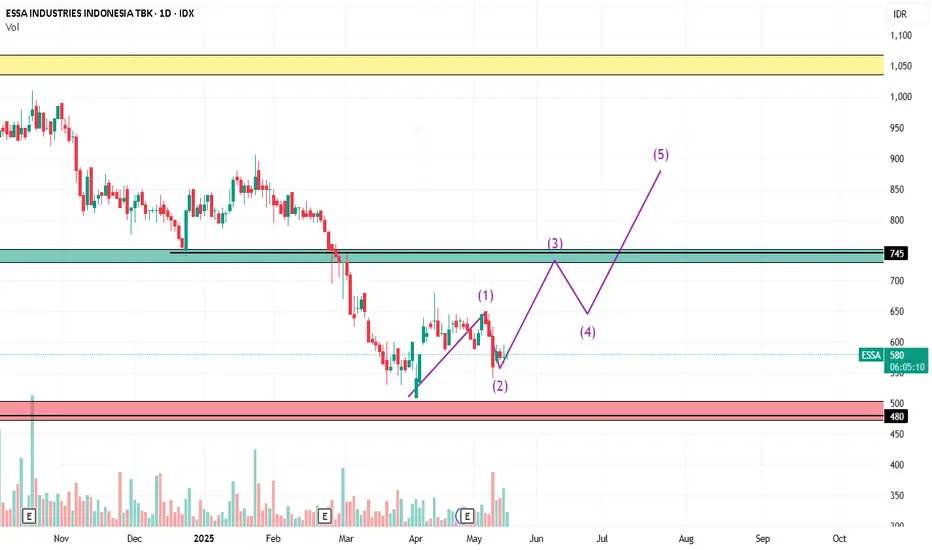
ESSADISCLAMER
essa sl 480
take profit 745
Wait for the update for both take profits. If it hasn't been updated, you can use a future take profit.
MNCNDISCLAMER
for take profit can be long term because in the long term the market is still bearish and keep the cutloss
sl 248
tp1 296
tp 2 340

GOTO With news speculating around a possible merger between GOTO and GRAB, there might be some good news for the stocks as well. We’ve got an Inverted Head and Shoulders pattern forming here, and we might expect a bounce back as we re-enter the testing zone. But we need to be cautious at the support level if it breaks down, the reversal fails.
#FREEBANDZ #NOTAFINANCIALADVICE

ANJT - POWER PLAYPosition Update: May 6, 2025
Key factors:
1. Low-risk entry point.
2. It has a very tight correction area.
3. A strong sign of continuation of upward momentum.
4. Corrects below 4% during this pause, indicating big institutions' reluctance to sell their positions.
5. High relative strength, outperforming the general market.
5. The stock is moving on its own universe and marching to its own drummer.
6. Volume diminishes during the correction, indicating less supply coming to the market.
7. The general market is in the early stages of a bull campaign.
8. Huge volume on the breakout
Consideration: Not many traction in the market so far.
This is a classic Power Play setup, featuring two viable entry points. My initial position was taken on April 14 from the low cheat and added big on a very clear pivot point today. I’m looking forward to seeing further constructive price action moving forward.


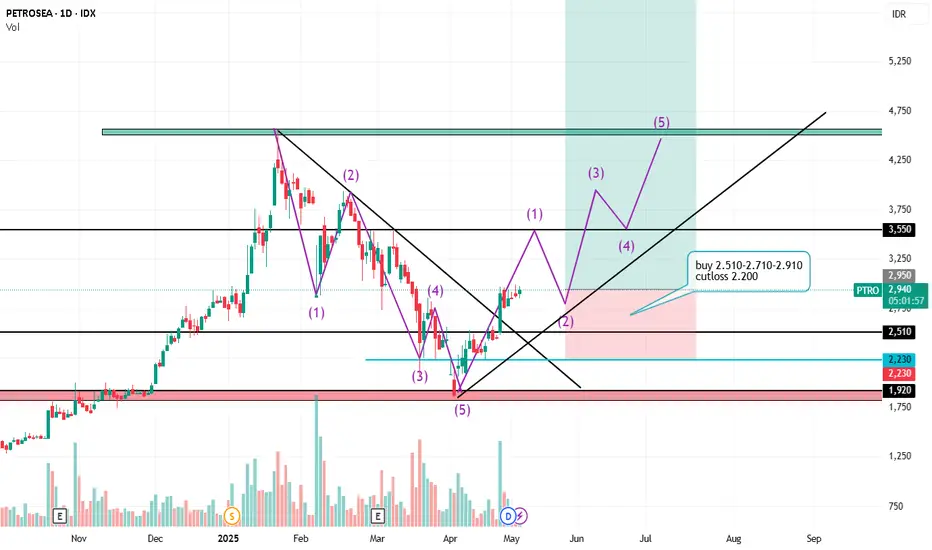
PTRODISCLAMER ON!!!!
ptro
entry buy can be from 2,510-2,710-2,920
cutloss htg 2,200
tp1 3,550
tp 2 4,500
tp 3 6,200
for long term tp3
patience is success
cutloss is still important
BMRI i think BMRI still on correction area, might go to 6000 - 6200 for this or next year and correction continue

Applying technical analysis in multiple time frames: $GPRA
Monthly
• Trend and momentum using Joe Rabil Method:
- Step 1 and Step 2 are formed – Mapping (Step 3)
- Watch if MACD can stay above 0 line
Weekly
• Trend and momentum using Joe Rabil Method:
- Step 1, Step 2 and Step 3 are formed (presumptive uptrend); unfortunately, price cannot close above Step 3!!
- 18MA is already cupping around – early sign of change in trend
• Harmonic Pattern: Mapping (Bearish Gartley)
• Elliot Wave: Mapping 12-(345) OR AB-(C)
Daily
• Trend and momentum using Joe Rabil Method:
- Step 1, Step 2 and Step 3 are formed (presumptive uptrend)
- 18MA has crossed 40MA and both are rising + MACD is up – trend confirmation
- Watch if both MA can rise in the same direction with good separation
10M
• To be watched: price action, MA and if MACD can make 0-line reversal if it is down to 0 line.

MFIN - VCP (16W 41/18)IDX:MFIN - VCP
(+):
1. Low risk entry point on pivot level
2. Volume dries up
3. Price above MA 50 > 150 > 200 over 10 weeks
4. Price is within 25% of 52 weeks high
6. Price is over 30% of 52 weeks low
7. 200 day MA trending up over 1 month
8. RS Rating is over 70 (95)
9. EPS Growth:
a. Quarterly QoQ: +22.24%
b Quarrerly YoY: +185.92%
b. TTM YoY: +22.24%
c. Annual YoY: +23.08%
(-)
1. Breakout with red candle
2. Lack of liquidity

NCKLnckl
long term target price 1,100
medium term target price 995
short term target price 885
keep cuttloss price 650
