


BBRI Forecasting1. Break Nearest Resistance 1
2. Possibly retest inside Resistance 1 and become support

KING - VELOCITY PLAYI have my positions now
March 24, 2023
The reasons:
1. Low-risk pivot point
2. The stock offers the first buyable base after an IPO
3. It skyrockets up 100% immediately after it went public
4. High relative strength, outperforming the general market
5. The stock is moving on its own universe, marching to its own drummer
6. A decent shakeout, weeding out week holders
7. Big volume on the breakout
Flaw:
Only 6 days pause, 8 days or more is much preferable

BBCA - POTENTIAL DROP BEFORE BULLISHBBCA - POTENTIAL DROP BEFORE BULLISH
BBCA has reached it's peak and now potentially making a secondary reaction before continuing it's bullish continuation.


Potential Bullish Trend for Daily Chart AKRAOn the 31st March, AKRA seems like starting to trending up. It priced higher than its MA 50, MA 100 and MA 200, and the MACD also is showing uptrend (near its golden cross).
From past experience, using the same method:
It increased 69% starting from 20 Apr 2022 up to 28 Dec 2022 (8 months)
It increased 33.64% starting from 12 Aug 2021 up to 25 Oct 2021 (2 months)
And lastly, 30.98% from 9 Nov 2020 to 21 Dec 2020 (2 months)

[ARKO] ARKORA HYDRO TBK (IDX)I dont know much about the fundamental, so this is just my perspective from Technical Aspect.
Disclaimer ON.

BBRI: The Advancing Phase and Recovery of Banking Sectors? Hello Fellow Global Stock Investor/Trader, Here's a Technical outlook on BBRI!
Support the channel by giving us a thumbs up and sharing your opinions in the comment below!
Technical Analysis
BBRI is a breakout of the Pennant Pattern after retracing on the Fibonacci golden ratio area. The MACD Indicator made a golden cross below the zero level area, which indicated a potential bullish movement ahead.
All other explanations are presented on the chart.
The roadmap will be invalid after reaching the target/support area.
"Disclaimer: The outlook is only for educational purposes, not a recommendation to put a long or short position on the BBRI"

TLKM: Inverted Head & Shoulders, Trend Reversal Scenario?Hello Fellow Global Stock Trader, Here's a Technical outlook for TLKM!
Price Action Analysis
On the Daily Timeframe, TLKM is moving above EMA200. Then, the stock created a breakout of the inverted head & shoulder, indicating a trend reversal. The MACD Indicator created a hidden bullish divergence, signifying a possible upside movement to the target area.
All other explanations are presented on the chart.
The roadmap will be invalid after reaching the target/support area.
Support the channel by smashing the rocket button and sharing your opinions in the comment below!
"Disclaimer: The outlook is only for educational purposes, not a recommendation to put a long or short position on the TLKM"

HALO - PRIMARY BASEI bought my positions today
March 9, 2023
The reasons:
1. Low-risk pivot point
2. The stock offers the first buyable base after an IPO
3. Low-cheat level (it is preferable for IPO base)
4. High relative strength
5. IPO breakout is working fine this far
Flaws:
1. Stock closed squat
2. Lack of volume on the breakout
So far, it acting normal. I like to see some constructive action in the upcoming days.

HRTA - POWER PLAYI bought my positions today
April 5, 2023
The reasons:
1. Low-risk pivot point ;
2. The stock is up >100% in less than 8 weeks;
3. Corrected the least during the pause, less than 25% correction;
4. Volume dries up as a sign of less supply coming to the market; and
5. It breakouts with huge volumes.
The flaw:
Stock squatted on the closing day

CRAB (VCP - 26W 25/5 4T)I bought my positions today
March 28, 2023
The reasons:
1. Low-risk pivot point
2. This is the first buyable base after an IPO
3. Long base VCP setup
4. Volume dries up as indication of less supply coming to the market
5. 1 - 2 punch with huge volume on the breakout
6. The weekly-base looks even more attrative
The flaws:
1. The stock still has to absorb a lot of overhead supply on the left side
2. It squats today after the breakout

BBCA BACK TO BULLISHAs you can see BBCA alrady filled the demand area!
I call to Buy this STOCK 7600
SHORTTERM TARGET IS ON GAP 7900-8075

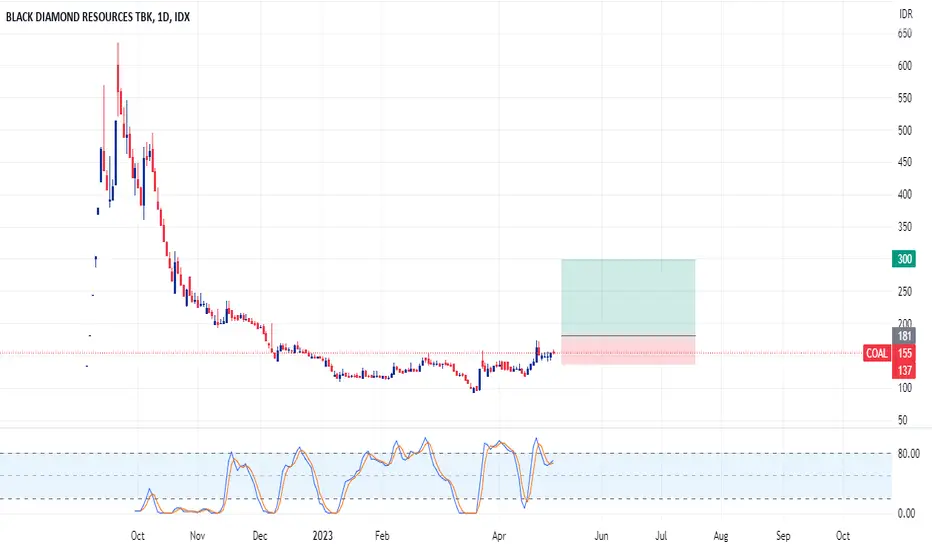
ABMM Breakout Market StructureABMM finally breakout major market structure which is good indication as reversal trend. Waiting for the confirmation, BUY if throwback to the blue area.
Watch out for the Target Zone and StopLoss area.
*disclaimerON