NCKLnckl
long term target price 1,100
medium term target price 995
short term target price 885
keep cuttloss price 650

Applying technical analysis in multiple time frames: $RAJAMonthly TF
• Trend and momentum using Joe Rabil Method:
- After a strong uptrend, the price violently moves back to 18MA.
- Setup Pattern: MACD Pinch Play
Weekly TF
• Trend and momentum using Joe Rabil Method:
- Look out for Trigger 1 or 2
Daily TF
• Trend and momentum using Joe Rabil Method:
- Downtrend and pullback
• Harmonic Trading:
- Mapping Bullish Bat with target 38.2 and 61.8
• Elliot Wave:
- Mapping 123-(45) OR ABC
1H TF
• Trend and momentum using Joe Rabil Method:
- Daily Pullback is Presumptive Uptrend in 1H TF
• Elliot Wave:
- Mapping 12-(345) OR AB-(C)

TAPG - VCP (20/5 3T)IDX:TAPG VCP
(+):
1. Low risk entry point on pivot level
2. Volume dries up
3. Price above MA 50 > 150 > 200 over 10 weeks
4. Price is within 25% of 52 weeks high
6. Price is over 30% of 52 weeks low
7. 200 day MA trending up over 1 month
8. RS Rating is over 70 (84)
9. Biggest net income +197.70% on Q4 2024 vs Q4 2023
(-)
1. Breakout with huge volume but created long red candle

NICL - VCP (192W 82/24)IDX:NICL VCP
(+):
1. Low risk entry point on pivot level
2. Volume dries up
3. Price above MA 50 > 150 > 200 over 10 weeks
4. Price is within 25% of 52 weeks high
6. Price is over 30% of 52 weeks low
7. 200 day MA trending up over 1 month
8. RS Rating is over 70 (93)
9. EPS Growth:
a. Quarterly QoQ: +45.05%
b. TTM YoY: +872.03%
c. Annual YoY: +1,029.03%
(-)
1. Breakout with low volume

LSIP stockLSIP are move in palm oil industies and indonesia have big potensitial og it
all of the fundamental according to buffet principle
target PBV=1

JPFA is callingAfter 22 April 2025, IDX:JPFA drop 190 (-9.97%) from the current price.
With the distributed dividen value Rp 70 (estimated 3% from the price)
Technical:
At the lowest area Fibb Retracement
Still above support line 1,740
Above EMA 200 (Weekly TF)
Fundamental
Growth Revenue each quarter
Good Debt to Equity Ratio (show good progress)
Target 1 : 1,945
Target 2 : 2,200
Thankyou for your time!
I hope everyone get the best for your life!

TLKMDISCLAMER!!!!
You can buy it in installments and the cut loss is at 1,920
this is a long-term analysis because it is a monthly analysis

BBRI Weekly Outlook – Testing a Multi-Decade TrendlineTicker: BBRI (IDX)
Timeframe: Weekly
Status: High-Priority Technical Watchlist
🔹 Long-Term Structure
BBRI is currently testing a major ascending trendline that has been in play since 2008. This zone has historically served as a reliable long-term inflection point, having been tested multiple times over the past 15+ years.
The trendline has held six or more significant touchpoints, strengthening its technical validity.
Price action is also aligned with a horizontal demand zone (approx. 3,400–3,700), previously seen during the accumulation phases of 2019–2020.
📉 A Controlled Correction?
The recent correction has formed a descending channel structure, but:
The current drop is accompanied by high volume, which may indicate a capitulation or panic-driven sell-off.
Price behavior at this key junction will determine the next major phase: a base reversal or a structural breakdown into a broader downtrend.
🧠 Risk-Reward Outlook
If this long-term support holds:
A technical rebound toward the 4,800–6,500 zone remains well within reach.
The current setup presents a favorable risk-to-reward profile for medium-term positioning.
However, a weekly close below 3,200 would invalidate the bullish scenario, potentially triggering a decline to the 2,400–2,100 area — a demand zone from back in 2016.
📌 Strategic Takeaway
“BBRI is at one of the most critical technical inflection points of the past decade. This is more than just a trendline — it reflects long-term investor conviction versus macro pressure.”
Recommendation: Wait for confirmation from a reversal candle on the weekly timeframe. Patience is key — but this is not a zone to ignore.

$IDX:SMGR long with target price 2900 within 90 daysLONG position on IDX:SMGR with a target price 2900 in 90 days. Analyst price targets averaging 3,185.83 IDR, higher than the current 2,140.00 IDR.
A Price-to-Book (P/B) ratio of 0.33 for Semen Indonesia (Persero) Tbk ( IDX:SMGR ) suggests that the stock is trading at a significant discount to its book value. SMGR’s low P/B ratio of 0.33 could make it an attractive target for foreign investors looking for undervalued assets. The low P/B ratio and EV/EBITDA NTM ratio indicate undervaluation compared to peers. This could appeal to value investors looking for bargains. Qatar has recently shown interest in Indonesian sectors like energy, tourism, and real estate, but nothing explicitly ties IDX:SMGR to Qatari funds. Without concrete deals or announcements, it’s speculative.
However, low P/B can also signal concerns. The market might be pricing in risks like declining profitability, operational challenges, or sector-specific headwinds—cement is a cyclical industry tied to construction and infrastructure, which can be volatile. It’s also possible that the book value itself is inflated due to outdated or impaired assets.
Current Share Price 2,140, 52-Week Low 2070, 52-Week High 5650. The current share price of 2,140.00 IDR, near the 52-week low, might suggest a buying opportunity for value investors, especially given IDX:SMGR ’s role as a state-owned cement giant tied to Indonesia’s infrastructure sector. Likely that infrastructure spending in 2025, including the new capital Nusantara, will boost cement demand, supporting long-term growth. IDX:SMGR holds over 40% of Indonesia's cement market and has recently acquired Semen Baturaja, potentially enhancing efficiency.
Given the undervaluation, significant infrastructure spending, and analyst optimism, IDX:SMGR appears to have potential for a long trade.

BMRI Just Waiting HereBMRI create double top formation in big timeframe 4200 is reasonable if this stock will rebound, but this big cap need more accumulation phase from big player
3600 area is make sense if we can touch it, all in

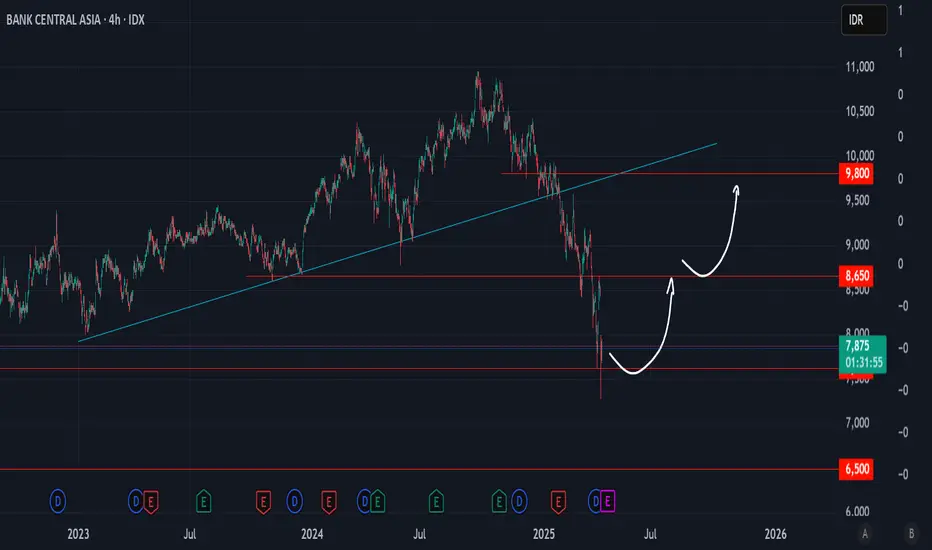
BBCA One of the best timesOne of the best times to buy blue chip stocks from Indonesia which is currently discounted 30% from ATH
Quite simple, if it breaks and closes below 7600 then the bearish trend will continue and maybe we will meet 6500, but if 7600 is strong then we will likely push up with the first target at 8600 then 9800
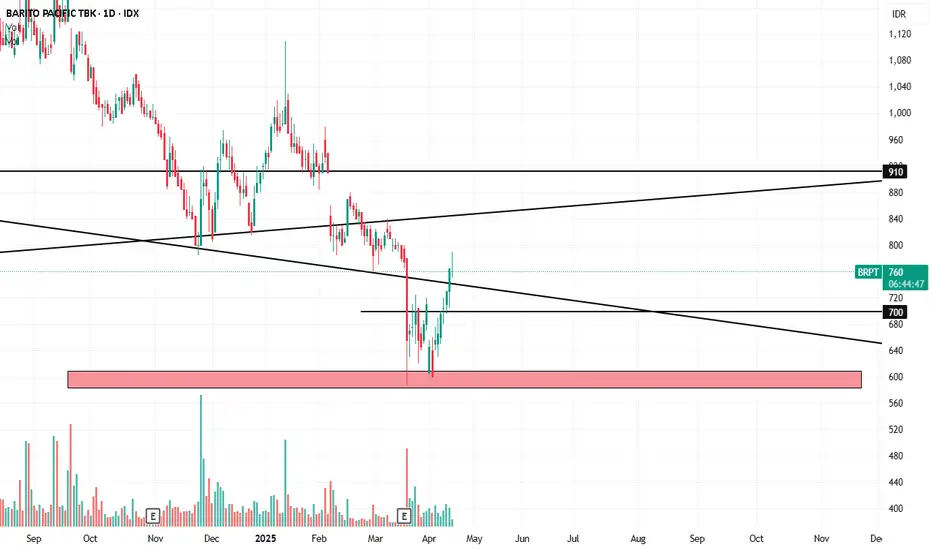
BIPIDISCLAMER !!!!
already exited the bearish channel and now it's bullish
cutloss price 65
target 1 100
target 2 111
target 3 125

ELPI (VCP - 26W 14/4 3T)Position update: March 25, 2025.
Key factors:
1. Confirmed stage 2 uptrend.
2. A textbook double bottom with VCP characteristics.
3. Has gone through its majority line of supply.
4. Moving on its own drummer, the stock consolidates while the index suffers a terrible decline.
5. High relative strength.
6. Volume dries up as less supply coming to the market.
7. Strong fundamentals, with consistent year-over-year earnings growth.
Considerations: Despite these strengths, the broader market remains in a bearish phase, down over 20% from its all-time high. Geopolitical risks, persistent net foreign selling, declining investor confidence, and concerns over the government downplaying the stock market's significance continue to contribute to an unstable market environment.

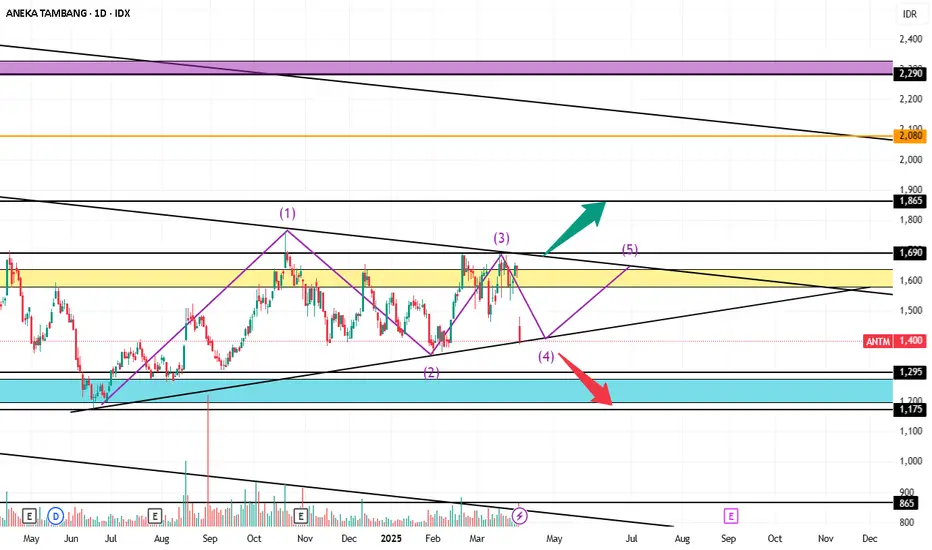
ANTMDISCLAMER !!!!
I WILL SHARE ANTAM'S IDEA IN 2 STAGES
STAGE 1
with a long term and installment purchase, don't go all in
buy from a price of 1,400-1,175
SL 1,100
TP 1 1,865
TP 2 2,080
TP 3 2,290
stage 2
wait and see first
wait for price breakout 1,690 then buy and
sl 1,595
tp 1 1,865
tp 2 2,080
tp 3 2,290
in the medium term antm is still bearish
sl is important, friends, don't forget sl to keep your money safe
BBCACurrently BBCA still in bullish trend, I see BBCA will potential correction. If BBCA correction will going to :
support 1 6500
support 2 5500

BBRI IJ Currently BBRI IJ Still is in a bullish trend, I see BBRI IJ will going to :
support 1 2500
support 2 1750

Weekly Chart INDFFrom 2019 to 2025, wide range sideways
Buy Area : 5850-5500
TP Area : 7900-8250
Maximum Gain : +-35% between support and resistant
if breakout resistant 8300, potentially goes to All Time High Level
if entry in buy area, low risk loss of 10-14% (so, good risk reward ratio 1:3)

Weekly Chart BBRIBBRI rebound support 3500,
weekly chart pattern : falling wedges
if breakout falling wedges, potentially goes to All Time High Level
strong resisten and psychology level at 5000 (why strong? 4 times swings)


NCKLDisclamer on!!
nckl potential buy price 640 target 1 785 and
long term price 995, cutloss if price breaks 600

ANTM Elliott Wave CountQ4 2024 is set to be very shiny for ANTM. Gold sales for Q4 only equals to 15 tons, meanwhile the first 9 months of 2024 amounts to only 28 tons. Additionally, nickel sales also jumped in the fourth quarter.
Chart-wise, ANTM just finished its fourth wave yesterday, quite a steep drop. Volume during was really good from the first until the third wave, and it dried up on this current fourth wave.
The target for ANTM is about 1750-1765.

BBRIBbri
Wait and see first
For long investors,bbri is still bullish but for trader or beginner investors,do not enter first
Because for the weekly the price has breaked thru MA200,we will monitor whether the support of 3.350 will break through or not i fit breaks through
We will monitor the price of 2.650-2.950
