INDY (VCP - 26W 32/5 4T)I got my pilot position on 30 Aug 2022.
The stock breakout of that majority line of supply.
Today, I don't add to my position due to my progressive exposure plays. I'm not getting so aggressive yet.

UNTR (VCP - 13W 22/3 3T)I got my pilot position on 2 Sep 2022.
The stock broke out of a classic VCP setup, it also has strong fundamentals.

ADRO - PULLBACK BUYI have pilot positions from a pullback buy.
The stock gets some support on the 4th day of a pullback before I initiate my low-risk position.

PWON potensial roadmapPWON or pakuwon jati potensial make new swing on weekly chart move to 550 to 560 as last resistance. break 560 will aim new resistance in this year about 600-620. For medium term till this desember 560 potensially reach.

INTP Prepare for BreakoutINTP . Weekly TF. Falling wedge . Wait for higher low in daily TF, might be around level 9700.
TP1 12950
TP2 15975
TP3 22700
---------------
SL 8625

INTP Waiting for Higher Low INTP . Weekly TF. Falling wedge. Wait for higher low in daily TF, might be around level 9700.
TP1 12950
TP2 15975
TP3 22700
---------------
SL 8625

ADARO Wave analysisAt this point I expect ADARO to go up. here are some reasons
1. Elliot wave analysis on Adaro shows that it is currently correcting (Zigzag) and will form the last impulsive wave (wave 5)
2. Adaro is in a tight supply and demand area at Fibbonacci 38.2%-61, 8% .
3. The resistance line at 1900 has been broken (round numbers crossed are usually a good sign).
4. if you look at the H1 chart, a symmetrical triangle is formed which is rebounding.
If I buy this stock then I will buy it now with SL 1 at 1245 and SL 2 at 1005 with TP at exactly 3000. However, it is better to consider the fundamentals of the company.


AKPI (VCP - 15W 35/7 3T)I initiated a pilot position on 12/9/22 from a pullback to the 3rd contraction of VCP.
I expect it to tighten up more for the last contractions (4T), but it doesn't happen.

MBAP - CUP WITH HANDLEI got into a full position today on this classic cup and handle pattern.
This is not the environment for a full 25% position, but I see the very constructive price action and fundamentals in the stock.
However, on the closing day, the stock keeps coming down to its breakout level and forces me to reduce my position in half.


PANS - 3CI have my starting position today on the cheat level breakout.
The stock appears to have well-constructed price action and strong earnings.

Sample RetraceHere a sample of trend of pani trying to built, a red wick continuously followed by fractal. Will they recover that green wick?


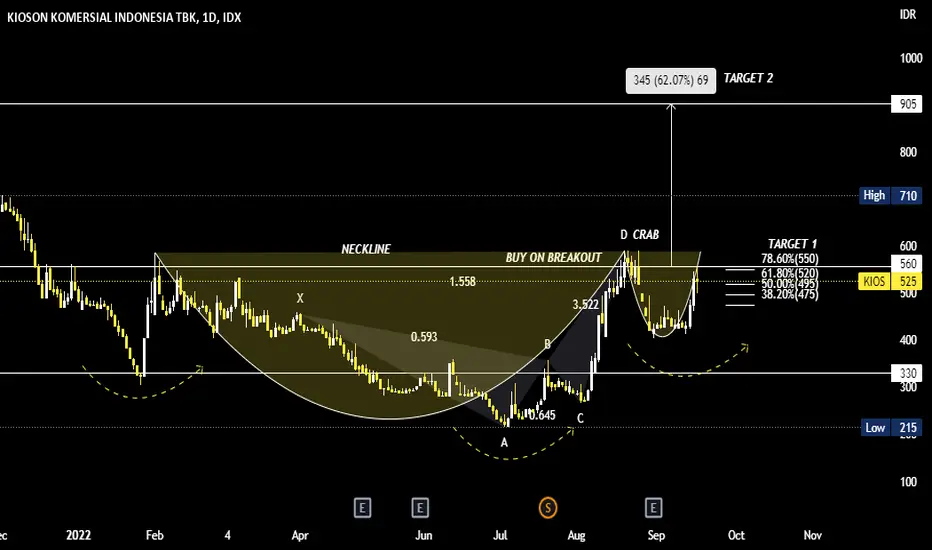
KIOS My Bullish ViewKIOS My Bullish View. Inverted Head and Shoulders. Cup and Handle. VCP. Harmonic Pattern Crab.