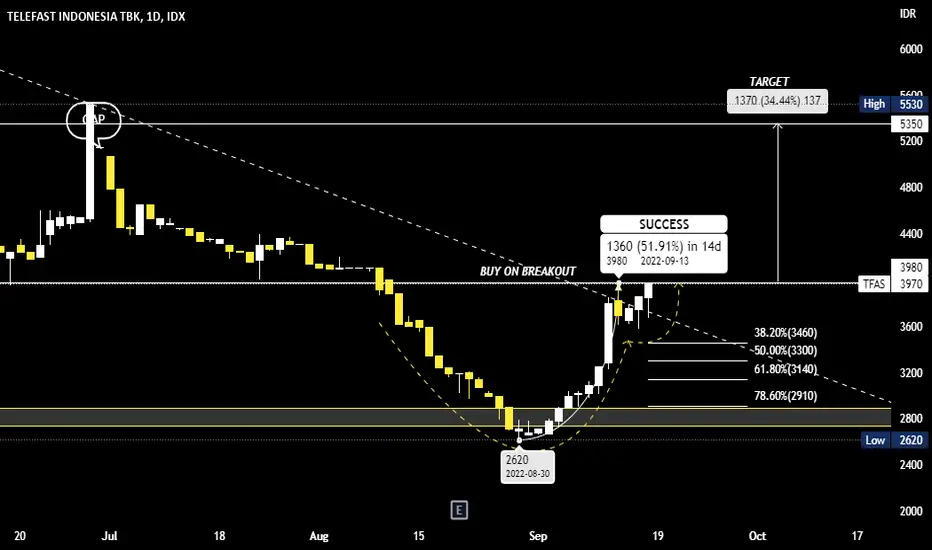
SLIS My Bullish ViewSLIS My Bullish View. Harmonic Pattern BAT. Cup and Handle. VCP. High Tight Flag.

SELL TOWRReason to enter sell
1. price demand zone (redline)
2. confluen snr (greenzone)
3. massive bearish candle (weekly). if close candle like this when this analysis created


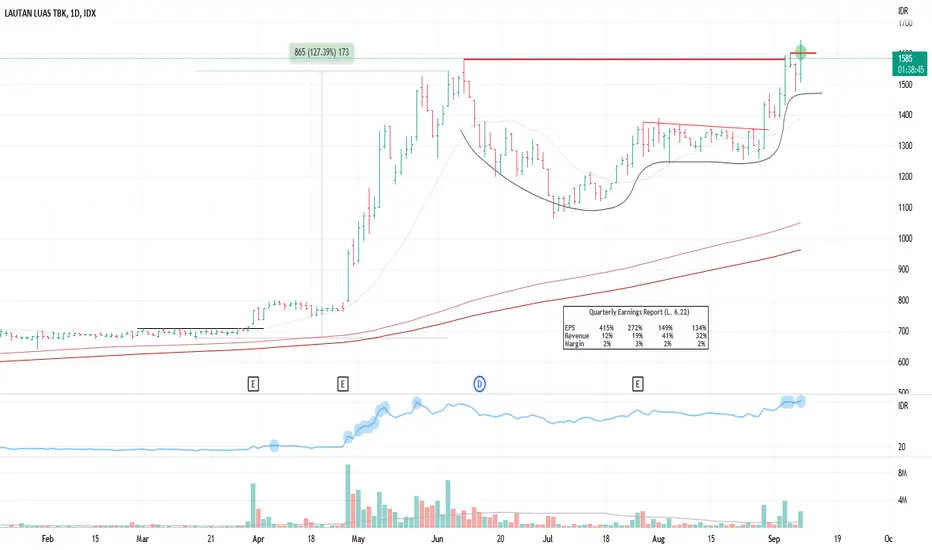
LTLS - CUP WITH HANDLEI got my pilot position today on the handle.
The stock broke out with huge volume. It has a perfect 3C for earlier entry beforehand.
INCO Descending Broadening WedgeINCO . Daily TF. Descending broadening wedge pattern. Already breakout the pattern. TP1 7125, TP2 8250, TP3 10550. But take note, there is a gap at 6450-6525. It might go down to that level to fill the gap after hit TP1, before it take off to chase TP2 and TP3. SL 5725.


GZCO UP? (GOZCO PLANTATIONS TBK)GZCO rebound on support also EMA 200 TF 1 Day.
Also MACD across signal.
You can see high volume in 1 Day. Seem it will be bullish and correction finish.
note: only take position after confirmation and do your own research before trading.

WIKA Buy on BreakoutWIKA . Daily TF. Ascending triangle pattern. Buy on breakout. Whenever it breakout 1090. TP 1220 SL 1020.


CTRA Bullish Pennant?CTRA . Weekly TF. Pennant pattern. Buy on breakout the pattern. TP1 1345, TP2 1625, SL 790.

SIDO at SupportSIDO . Weekly TF. Now at support. Will it be up or down? Will the support bounce it back or it can not hold the bear preasure?
In my opinion, it probably will bounce. Scenario A to create the first lower low after it broke down the trendline.

TLKM Diamond Shape - be Careful ⚠️TLKM. Daily TF. Diamond pattern. Usually, if diamond pattern appears, it will go to the opposite direction. Just be careful.

ASRI: Rebound of The Strong Support, Bull Bias Ahead to 196?Hello Fellow Stock Investor/Trader, Here's a Technical outlook of ASRI Stock!
Chart Perspective
ASRI has rebounded around a strong support area. The MACD Indicator created a golden cross, signifying a potential upside movement to the target area.
All the explanations are presented on the chart
The roadmap will be invalid after reaching the target/ support area.
"Disclaimer: The outlook is only for educational purposes, not a recommendation to put Long or Short Position in ASRI Stock".


IDX: TLKM FOR SEPTEMBER 2022Strong support at 4510
Medium resistance at 4660
I Prefer Yellow trading plan
Disclaimer:
This information is for educational purposes and is not an investment recommendation or representative of professional expertise. This analysis used herein is for illustration purposes only. This personal opinion should not be considered specific investment advice. I am not responsible for any trades, and individuals are solely responsible for any live trades placed in their own personal accounts.

IDX: BBRI FOR SEPTEMBER 2022Medium support at 4550
Weak resistance at 4650
I Prefer Yellow trading plan
Disclaimer:
This information is for educational purposes and is not an investment recommendation or representative of professional expertise. This analysis used herein is for illustration purposes only. This personal opinion should not be considered specific investment advice. I am not responsible for any trades, and individuals are solely responsible for any live trades placed in their own personal accounts.

INAF Strong Support at 880INAF still has no find any strong support yet. 880 could be the strong support to rebound.

ESTA Strong Support at 113ESTA potentially could rebound at 113 as it has reason for strong support from past movement.

BISI coul rebound at 1205BISI has not reach strong support yet. Potentially could hit and run ar 1205.
