UNTR - CUP WITH HANDLEIDX:UNTR CUP WITH HANDLE
13-12-2024
(+):
1. Low risk entry point on nice drifting handle
2. Price above MA 50 > 150 > 200 over 10 weeks
3. Price is within 25% of 52 weeks high
4. Price is over 30% of 52 weeks low
5. 200 day MA trending up over 1 month
6. RS Rating is over 70 (79)
7. Price break major downtrend, it's mean the stock started on Stage 2 uptrend
(-):
1. The stock is slow mover, it will take a while to reach the target
2. The volume when the stock is breaking out not quite big
Note:
Volume not dries up cause of big capital stock, some of big capital stocks doesn't need to dries up their volume

PANI - LOW CHEATPosition Update: December 6, 2024
Key factors:
1. Low-risk entry point.
2. The stock offers a low cheat, a creative entry.
3. The stock moves so rapidly in the last couple months.
4. A 30% pullback from its all-time high indicates a normal profit-taking phase within the context of a broader uptrend.
5. High relative strength, outperforming the general market.
5. The stock is moving on its own universe and marching to its own drummer.
6. Volume diminishes during pauses, indicating less supply coming to the market.
7. The breakout was confirmed with a notable surge in volume, reflecting strong buying interest.
Consideration : The current market environment remains challenging, with broader indices showing uncertain and inconsistent behavior, failing to sustain a bullish trend. This creates a "hard penny" environment, where gains are harder to secure and require precision.
This is a creative early buy in anticipation of a possible cup-with-handle formation. The current setup presents an opportunity to establish a position at a low-risk entry while awaiting the potential development of a handle in the coming weeks.


BBRI Is Going To Bottom in Mid-DecemberAfter a constant barrage of selling from March until June, and then quite of a rebound from 4100 to 5600 (almost 40%), BBRI continues to dive almost everyday since mid-September. This is supported by the huge foreign outflow BBRI has been suffering. Last Friday, BBRI's foreign outflow amounts to IDR823 billion. To put into perspective, IHSG Friday foreign outflow is IDR1.6 trillion, which means BBRI accounts for more than half of the outflow from IHSG.
Technical wise, BBRI has now constantly being traded under its 200 day moving average for almost 3 months. BBRI will most likely complete the (iii) wave of the C wave next week around 4100. Volume on last Friday's trading is relatively large. This means selling has not eased yet. I believe BBRI will bottom under 4000 ; 3700-3800

NEST (VCP - 7W 8/3 3T)Position Update: December 6, 2024
Key factors:
1. Low-risk entry point.
2. A first proper and buyable base after an IPO.
3. Has gone through its majority line of supply.
4. Moving on its own drummer, the stock went up +96% while the index remains the same spot.
5. High relative strength stock.
6. Volume dries up as less supply coming to the market.
7. The breakout was confirmed with a notable surge in volume
Considerations: The current market environment remains challenging, with broader indices showing uncertain and inconsistent behavior, failing to sustain a bullish trend.
This is a quintessential VCP with clear contractions and a defined entry point. I’d like to see if it can hold up and follow through from here.

$NEST - POWER PLAYIDX:NEST - PRIMARY BASE
06-12-2024
(+):
1. Low risk entry point
2. Price surge up almost 100% since it’s IPO indicated that the stock is strong
3. Volume dries up with VCP characteristic during this tight pause
4. One of IPO leader after IDX:DAAZ
5. RS Rating is over 70 (80)
(-):
1. Not the best Power Play setup, on the textboox: There is an explosive price move up over 100% on huge volume within 8 weeks and not corrective more than 20%

UNTR Buy Setup1. Trend Confirmation:
Identified a Flag Pattern Consolidation after a bull, indicating a continuation in bullish market sentiment.
2. Fair Value Gap (FVG):
On the Daily chart, identified Fair Value Gap between 25.400 - 26.125
3. Trade Execution
Entry Price: 26.550 ( Engulfing Candle on 15 Nov 24)
SL: 25.300 (below FVG)
TP1: 31.500 (Previous High)
Risk-Reward Ratio (RRR): 1 : 4
Monitoring: Check-in daily closing price
4. Outcome:
Exit Price:
Profit/Loss: pips
-------------
Disclaimer
The analysis and content provided here are intended solely for personal journal and educational purposes. This information does not constitute financial advice, investment advice, or a recommendation to buy or sell any securities. Trading involves significant risk, and you should only trade with money you can afford to lose. Past performance is not indicative of future results. Always conduct your own research and consult with a qualified financial advisor before making any investment decisions.

PSGO - Primary BaseIDX:PSGO - PRIMARY BASE
25-11-2024
(+):
1. Low risk entry point
2. Volume dries up
3. Price above MA 50 > 200 over 10 weeks
4. Price is within 25% of 52 weeks high
5. Price is over 30% of 52 weeks low
6. 200 day MA trending up over 1 month
7. RS Rating is over 70 (78)
(-):
1. MA 150 < 200
2. The volume on breakout is too small

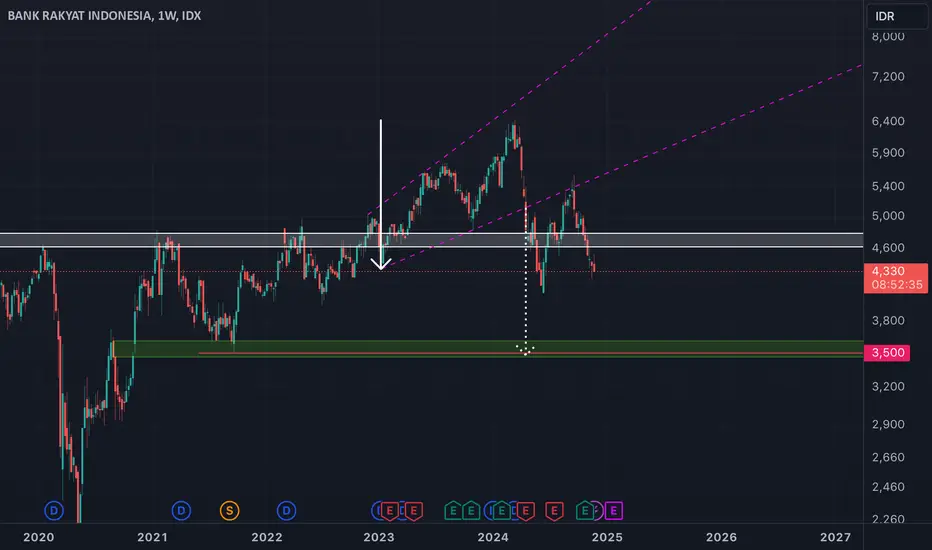
BBRI Will be Back to 3500.IDX:BBRI , weekly chart, ABW pattern.
There was an ABW (ascending broadening wedge) pattern detected. So, if we measured the high of the pattern, and took that value to the price where it breaks the bottom line of the pattern, we will see the next target price of the downhill is 3500.
BUY NOW - CPIN is likely to be bullishPrice shows rejection in the support area and no Breakout has occurred
ENTRY BUY AT 4740
STOP LOSS AT 4650
TP 1 AT 4970
TP 2 AT 5225

BUY NOW - ADRO is likely to be bullishPrice shows rejection in the support area and no Breakout has occurred
ENTRY BUY AT 3670
STOP LOSS AT 3550
TP 1 AT 3990
TP 2 AT 4220

BUY NOW - ASII is likely to be bullishPrice shows rejection in the support area and no Breakout has occurred
ENTRY BUY AT 4980
STOP LOSS AT 4840
TP 1 AT 5125
TP 2 AT 5275

INCO mid to longterm opportunity! Buy and hold?See the S1 and S2, it is safe to say that if those 2 support levels can hold, INCO will go up to a very nice and sweet target above.
CHEERS!!!

TINS BUYING OPPORTUNITY: Wait for the re-test or correction!TINS has broken its long consolidation and ready to take-off to the target (SEE CHART FOR TARGET 1, 2, 3), but its safer to buy it on a re-test or correction. Good luck!
CHEERRRSSS!!

BBRI is still on downtrend, what is a good entry price?I shared especially for mid to longterm investor,
I believe that right now BBRI is still on a downtrend to complete its WAVE C of ABC correction.
I have some levels to be considered for entry price for BBRI, first is as low as WAVE A (see the chart), and second is the supply and demand zone.
So.. LET'S DO IT!
CHEEERRRSS!!!

TLKM IS ON THE EDGE, R:R IS TOO GOOD NOW!From the R:R perspective, this stock offers a very good risk to reward ratio.
My first target would be on the first gap above (red line).
Tight SL is needed!
CHEERS!!!


BBCA (VCP - 26W 19/3 3T)IDX:BBCA - VCP
18-09-2024
Reason:
1. Low risk entry point
2. Volume dries up
3. Confirmed Stage 2
4. Price above MA 50 > 150 > 200 over 10 weeks
5. Price is within 25% of 52 weeks high
6. Price is over 30% of 52 weeks low
7. 200 day MA trending up over 1 month
Flaws:
1. RS rating less than 70
2. 5 biggest marketcap
3. No big volume on breakout

BIPI Buy Position1. Trend Confirmation:
Identified a Change of Character by the break of the previous high at 81, indicating a reversal in market sentiment and a new bullish trend.
2. Fair Value Gap (FVG):
On the Weekly chart, identified Fair Value Gap between 69 - 71.
3. Trade Execution
Entry Price: 74 ( Engulfing Candle on 5 Nov 24)
SL: 66 (FVG)
TP1: 110 (1.618 Fibbo)
Risk-Reward Ratio (RRR): 1:4.5
Monitoring: Check-in daily closing price
4. Outcome:
Exit Price:
Profit/Loss: pips
-------------
Disclaimer
The analysis and content provided here are intended solely for personal journal and educational purposes. This information does not constitute financial advice, investment advice, or a recommendation to buy or sell any securities. Trading involves significant risk, and you should only trade with money you can afford to lose. Past performance is not indicative of future results. Always conduct your own research and consult with a qualified financial advisor before making any investment decisions.

PANI - POWER PLAYPosition Update: October 16, 2024
Key factors:
1. Low-risk entry point.
2. The stock offers two entry points with a very tight risk.
3. A power play on top of another power play, this is a strong sign of continuation of upward momentum.
4. Corrects 18% during this pause, indicating big institutions' reluctance to sell their positions.
5. High relative strength, outperforming the general market.
5. The stock is moving on its own universe and marching to its own drummer.
6. Volume diminishes during pauses, indicating less supply coming to the market.
7. The general market is in the early stages of a bull campaign.
Consideration: Breakouts are not accompanied by substantial volume.
This is a classic Power Play setup, featuring two viable entry points: a low cheat and the handle. My initial position was taken on October 11 from the low cheat. I’m looking forward to seeing further constructive price action moving forward.

BMRI (Weekly) Potential forming DOUBLE TOPBMRI on weekly Chart seems forming Double Top pattern. But still safe as long as the price not break the bottom support at 5500 - 5550.
in my opinion as long as the price not going under 5500,we still can hold the position.
DISCLAIMER ON

PTRO - POWER PLAYPosition Update: October 22, 2024
Key factors:
1. Low-risk entry point.
2. The pause formed a small cup and handle.
3. It surged over 100% within eight weeks.
4. Corrects only 15% during on the pause, indicating big institutions' reluctance to sell their positions.
5. High relative strength, outperforming the general market.
5. The stock is moving on its own universe and marching to its own drummer.
6. Volume diminishes during pauses, indicating less supply coming to the market.
7. The general market is in the early stages of a bull campaign.
8. Huge volume on the breakout.
Consideration: Despite a favorable technical setup, risk should be managed diligently given the stock's sharp ascent and potential for profit-taking. Establishing stop-loss levels and monitoring market conditions is essential.
This is a textbook Power Play setup. I’m looking forward to seeing further constructive price action moving forward.

TPMA - CUP WITH HANDLEPosition Update: October 23, 2024
Key factors:
1. Low-risk entry point.
2. Very clear bases with VCP characteristics.
3. High relative strength stock.
4. Established a clear Stage 2 uptrend, indicating upward continuation.
5. The recent reduction in volume suggests diminished supply in the market.
6. Many stocks start showing traction based on my own stock continuum.
7. We are in the early phase of a larger bull market cycle, adding tailwinds to individual stock movements.
8. The market shows a constructive advance, with 55% of stocks trading above their 200-day moving average, indicating underlying market health.
9. Significant volume on the breakout, supporting the move’s legitimacy.
Considerations: Risk should be managed properly given the stock's sharp ascent and potential for profit-taking.
This is a textbook cup with handle formation which immediately showing its strength. The stock up 11% from my buy point today. I'll be closely monitoring its behavior to assess its ability to hold and build on these gains.
