LEUMI Retrospective - HVF method, 90% profit, R/R 9Retrospective analysis, targets defined using the Hunt's Volatility Funnel method.

NICE Macro 2014-2019Long term analysis of NICE (TASE).
After 6 years of slow grind up, it had great 5 bullish years. COVID-19 crash seem to have paused the momentum.
Conclusion: Looking good on the long term, on medium-short term seems to be dependant on general economy mood, but since NICE is providing services that are very required and maybe even more during a lockdown, it may be less susceptible to loss of business during this period.

BUY and BUY MORE if IT cross the green line !it will continue to climb next week, I advise you to buy and double your investment after crossing the green line


I Recommend SELLING trading algorithms changed the game ! The market will continue to decline in the coming days: I advise you to sell and wait for the buy signal

ATTENTION Trading algorithms decide to sell; The market will continue to decline in the coming days: I advise you to sell and wait for the buy signal


I recommend buying again in the next green candle FORMULA will return to climb in the next days
Because we are above the white line and we have a red candle matching with volume up

I recommend buying again Technical indicators indicate that continue to climb during the coming days
Wait for the next green candle to buy


I recommend buying again There is a high possibility that the market will continue to rise during the next week

Sell or buy?Technical indicators indicate the market will continue to rise during the next week
I Advaise you to buy again

Will continue to climb ? Technical indicators indicate the market will continue to rise during the next week

I Recommend SELLING Technical indicators indicate that the market has reached its highest level and we expect it to decline in the coming days

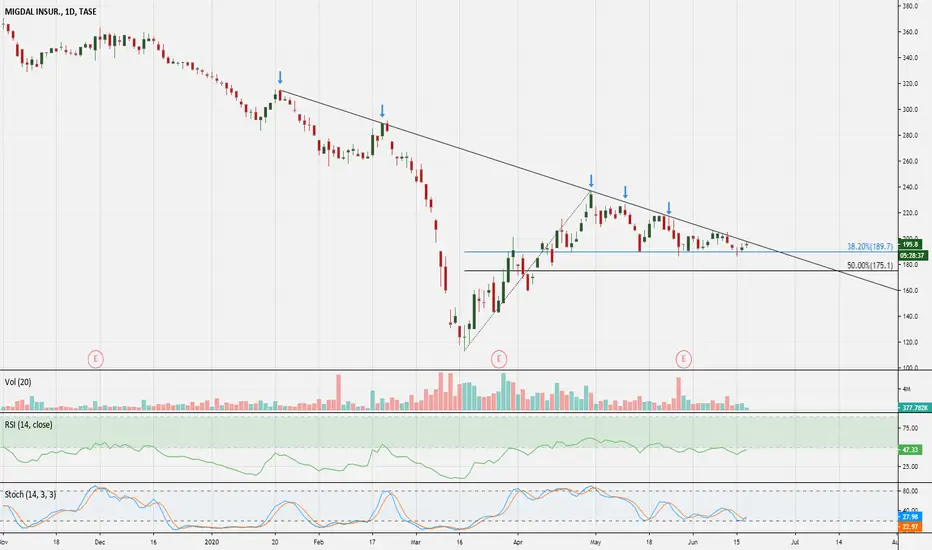
$MGDL - (TASE Only) interesting patternLong Only with breaking the downtrend line.
Good-luck to Holders.
TASE only.
NETANEL GROUP - LONGTASE:NTGR , LONG according to technical indicators, MACD ,RSI and Stochastic RSI, yield a "BUY" strategy after down phase will finished .


Cellcom predictionUsing channel lane and macd indicator . we assume we can sell more , because the chart continue their bearish in next months

Ilex Medical Using cycle and fibonnaci retraceent we can deduce . the chart keep their bearish up to april.

Speculative High-Return Idea - LONG "TEVA"I'm not gonna explain the fundamental data of the company for a long time, but I will say briefly that if you look at the dynamics of changes in the company's data, you can see a stable growth of the EPS indicators and a gradual moving towards a positive P&L. It is also indicative that with the huge fall of markets last week, the company did not “fly down” after the market. In the pharmaceutical sector, which itself is risky for investors, TEVA in recent months has shown good growth and the POTENTIAL for the long-term trend to transition from falling to rising. It has already broken up the resistance line lasting from the highest 2015 year point.
However, the idea of this post is no longer in long-term investment in this asset, but in speculative buying. The graph clearly shows the divergence of the asset price lows and its RSI and MACD indicators. According to Fibonacci, the stock adjusted to the desired level. Perhaps the fall to the level of 3703 Israeli Shekels and a rebound, or a rebound will be tomorrow. In any case, it is recommended to wait until the RSI fixes above 30 on the 1-hour chart, and then go into the idea. The way out of the idea is at least 4100 Shekels. Stop loss at your discretion, but 3650 is recommended.
If you do not have access to the Israeli market, then do not be discouraged, paper is also listed in America under the same name TEVA
P.S. It’s up to you to enter long-term or speculate, I recommend speculating only because I myself am a short-term speculator.

