LVMH sell signalHere on D chart we have Evening Start technical formation, RSI at his overbought level, and the price/MA200 difference is 10.6%.
On W chart I have one more nail- divergence.
My play is sell short.
Negative out at 400,
Positive out at 325

BMW, General Motors, Honda, Ford and Renault are working with tA group of major automakers are about to hit the road with the first field testing of a blockchain-based vehicle identification network next month in the U.S.
As reported by Nikkei Asian Review, BMW, General Motors, Honda, Ford and Renault are working with the Mobility Open Blockchain Initiative (MOBI) on integrating the system to automatically make payments on typical commuting runs without the need for cash or credit and debit cards.
By assigning vehicles unique identities that store data such as ownership and histories on a blockchain, the industry initiative aims to remove the need for a human when settling tolls and parking fees.
Founded in May 2018 by multiple major car manufacturers, MOBI has been working to enable the sharing of road data between manufacturers, a step towards developing self-driving cars.
As Nikkei writes, participating vehicles would eventually be able to automatically pay expenses once plugged into other networks such as charging or refueling stations.
MOBI is also looking into incorporating cryptocurrencies. One such system involved compensating users in crypto for putting energy back into the power grid following an outage.
A number of automakers are looking at blockchain for facilitating processes such as payments and data sharing, especially for the not-so-distant future where automated vehicles have become the norm.
This summer, CoinDesk reported how Daimler – parent company of Mercedes-Benz – partnered with blockchain firm Riddle & Code to produce a hardware wallet for automobiles. Looking long term at solutions for self-driving vehicles and car-sharing platforms, the firms’ wallet would also create a cryptographic identity for vehicles.
Jaguar Land Rover too is looking at rewarding drivers in cryptocurrency in return for their data

Tinexta target fissatoLa figura di analisi è stata confermata con la rottura della banda superiore il 17 Settembre, questa però è stata una rottura che nella sessione giornaliera non ha mostrato grande forza e sicurezza sul prezzo. La conferma di forza sul titolo è avvenuta con la chiusura della sessione di venerdì. Questa con prezzi che hanno avuto un incremento del 4% chiudendo a € 12,42 con volumi in crescita sopra le media mensile.
Questi 3 punti sono fondamentali per la conferma del pattern:
Movimento rialzista con forza (movimento del 4%)
Volumi sopra la media
Tempo di conclusione del pattern (per la conferma del pattern parallelo ci vogliono circa 3 mesi e questo su Tinexta si è verificato nel tempo richiesto).

A2A target a 1,9 euro, secondo target a 2,25 euro entro dic-2021Il tutolo, con la rottura a rialzo del testa spalle rialzista (neckline sulla linea verde) nel marzo del 2015, ha dimostrato di voler invertire il trend ribassista intercorso nel periodo 2008-2012.
Il movimento rialzista di A2A è sorretto da una direttrice primaria (linea rosa) e dalle direttrici secondarie (linee blu).
Le direttrici secondarie al momento sostengono la terza onda rialzista del titolo.
Target entro dicembre 2021:
il primo target è a 1,9 euro , da cui potrebbe scaturire uno storno, su cui accumulare posizioni.
Il secondo target e posto a 2,25 euro .

Bearish trend for TIT - TelecomitaliaTelecomItalia, will be a bearish trend untill the XABCD pattern is closed.
We stay short

BAYER found its way back to its long term uptrend channelChart Analysis
Let's have a look at MIL:BAY , the famous Monsanto buyer. Last weeks candle managed to close inside the long term uptrend channel and if we look at the monthly chart we can see a strong green confirmation candle forming. Of course we have still 5 trading days for this month, but maybe it works out. then it confir ms the reversal which happened at the 78.6 / 86 Fibonacci area.
risky... but there is a chance
Of course there a many risks and uncertainness in Bayer regarding the Glyphosate, but the company is looking for a roundup settlement in trails. For the marked this is good news, because Bayer accepts that they have to pay and don't fight against it.
So if they can negotiate this settlement the market has a clear number and there is an end of trails visible and possible.
Nothing is more difficult for a stock than (bad) unclarity.
Dividend
4.2% Dividend
46 % Payout Ratio
Monthly Chart

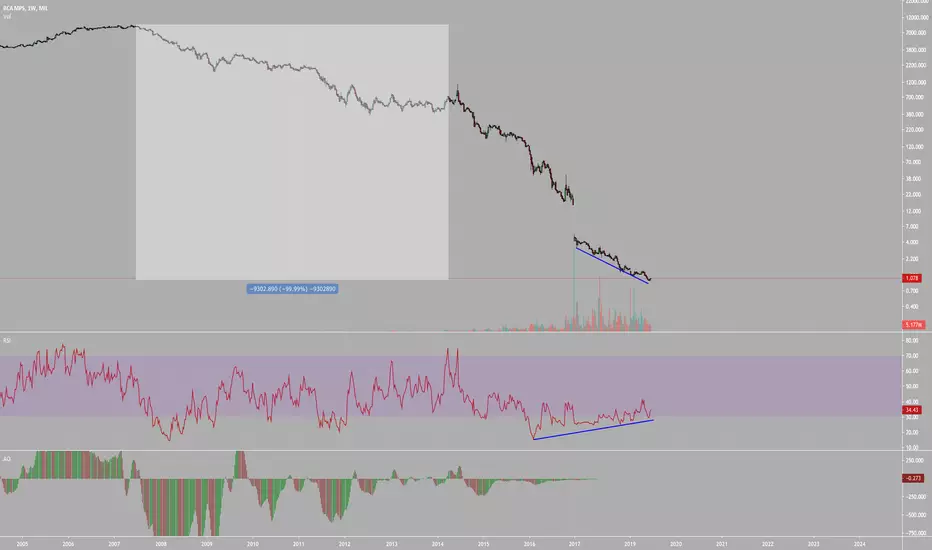
Bayer Buy IdeaW1 - Double cycle down, false breaks with bullish divergence.
D1 - Inverted head and shoulders pattern, price broke above the neckline, bullish divergence.
Any pullback is an opportunity to look for buys with more bullish evidences.

Ferrari expected downtrend theory on friday 15th aug.I'm expecting Ferrari stock to enter (longterm?) downtrend on friday the 15th. The marketprice might be overstated for the quarter earnings. It has already entered a short downtrend. After that it stabilizes a little bit. The stabilizing support line is stagnating while the longterm resistant line is falling. The lines will cross on 16th of aug. Thats weekend. So I would expect a fall on 15th of aug.
*sidenote* I just started experimenting with trend lines on charts this day (new to investing). It could be real bullshit what I'm selling, but I don't know. Please let me know what you think of this theory. All critics are welcome.

FERRARI IS IN III MAJOR WAVEIn my opinion Ferrari is in a III major wave. The race is still going. With the logaritmic chart the movements are more clear.


seguira dentro del canalmi prevision es que esta secion , sigua dentro del canal. buscando asi los 12.5


GLOBAL FINANCIAL ENGINEERING SWING TRADING STRATEGY FOR LVMH MoeOur Proprietary Trading System indicates the following:
The Primary Trend (PT) given by the Global Monthly TIME BAR (GMTB) is currently Bullish
The Secondary Trend (ST), given by the Global Weekly TIME BAR (GWTB) is currently Bullish
The Medium Term Trend (MTT), given by the Global Daily TIME BAR (GDTB) is currently Bullish
The Short Term Trend (STT), given by the Global Four Hour TIME BAR (GFHTB) is currently Bullish
We were hoping for a pullback to $343.75, but we might never see this level again within the medium term
In light of the above trend analysis we have started a bullish trade on LVMH Moet Hennessy Louis Vuitton SE using Global Trading Strategy #3 on the Global Automated Trading System #3 which trade in the direction of the Global Daily Time Bars (GDTB).
Global Entry Signal For Trade #1: Buy @ $381.75
Global Trailing Stop Loss Trade #1: @ $354.42
Global Target Profit Trade #1 : @ $600.00
Global Trade Management Strategy: We applied the Global Trailing Stop System for Global Trading Strategy #3.
Check updates
---------
The analysis in this material is provided for information only and is not and should not be construed as an offer to sell or the solicitation of an offer to buy any security.
To the extent that this material discusses general market activity, industry or sector trends or other broad-based economic or political conditions, it should not be construed as research or investment advice.
To the extent that it includes references to specific securities, commodities , currencies, or other instruments, those references do not constitute a recommendation by Global Financial Engineering,Inc. to buy, sell or hold such investments.
This material does not and is not intended to take into account the particular financial conditions, investment objectives or requirements of individual customers.
Before acting on this material, you should consider whether it is suitable for your particular circumstances and, as necessary, seek professional advice.

WAVE 3 ON GOING WITH TARGET 250€Ferrari is winning is race with this spectacular wave 3 on going. The first Fibonacci target of this wave is around 250€

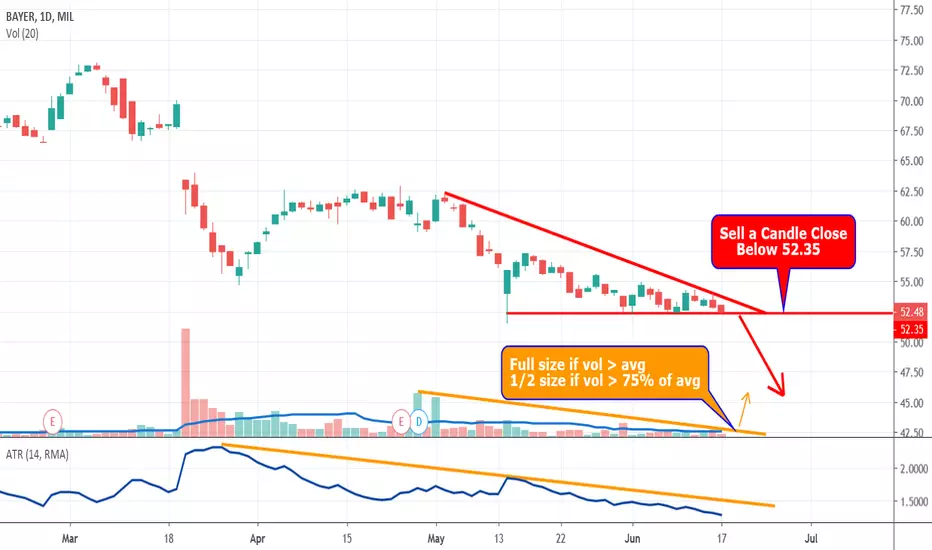
Is Bayer Going To Need Aspirin For Their Roundup Issues?Bayer is a descending Triangle Chart Pattern
Strong support level has been re-tested several times
Continually lower highs puts pressure on this support level
Best patterns have dropping volume and volatility/ATR
Fewer traders are interested in this consolidatation
At some point expect an explosive breakout
Trade Plan
Wait for a close below the support level
Full trade size if volume is at average atr line
1/2 trade size as long as bar has 75% of average volume
Enter two trade
Both trades SL is 1.5xATR
1st trade TP is 1xATR
2nd trade no TP let profit run
When price hits 1st TP move 2nd trade AL to breakeven
Let profit run
If breakout candle is more than 1 ATR wait for price to retrace back towards 1 ATR level to enter