MONDADORI LONG TIME OPERATION LONGMondadori has designed a clear rounding bottom. The prices are now on the 200 weekly SMA (Red area) and after a pull back on the SMA (over there has been a gate to enter) the prices are sustained from the SMA. LONG for a LONG TERM OPERATION until the prices are sustained from the SMA.
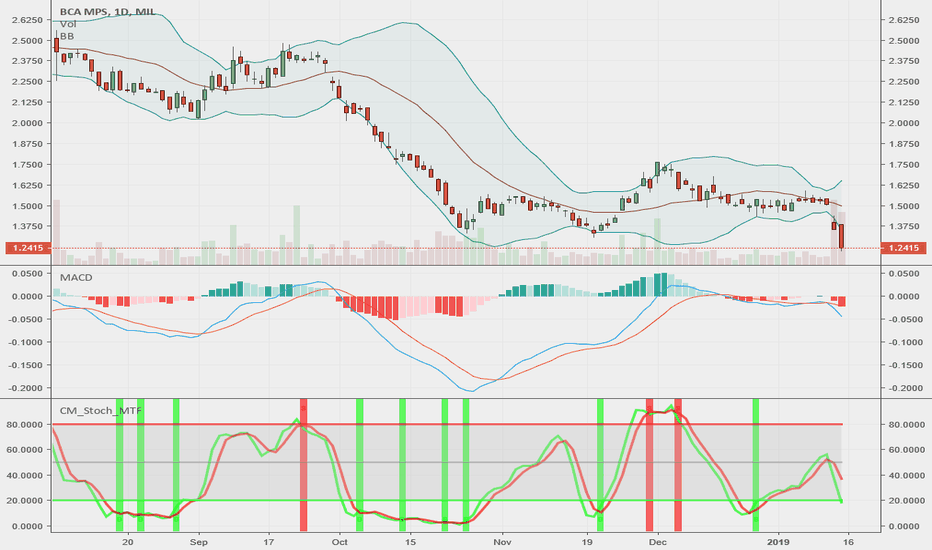
BANCA MONTE DEI PASCHI DI SIENA - SHORT Guys,
A long black candle associated to increased volumes and the widening out of the Bollinger Bands give us a clear indication about the
next direction downwards.
A closure below the horizontal support will be devastating. 1st target at 1 euro. There is much more room to see the stock tumbling down
below 1 Euro
Thank you guys,
Simone
SHORT A2A 8 RRR shortReposting this since TV removed this idea earlier for containing links to my telegram group.
Trading Methodology:
1. An asymmetric bullish/bearish pennant is drawn using ascending and descending curved trend lines with a minimum of three price action touche points per line. The direction is determined by the previous trend.
2. The angle tool is applied from the earliest two trend touch points, beginning at the earliest touch point.
3. A trend-based Fibonacci retracement triangle is drawn starting from the earliest trend touch point and ending at the earliest touch point of the opposite trend line .
4. Based on the degree, of the earlier defined angle, the appropriate (and secret) levels are selected for the fibonacci retracement ; two levels for stop-loss and two levels for take-profit. The closest stop-loss level to the current price level is the top priority stop-loss. Though the secondary stop-loss level is often chosen for some markets such as FX and some equities in order to account for seldom unexpected resistance breaks. The greater target level is the top priority, and where majority of the shares are sold, though some may choose to close part of the position at the first target level or set it to be the stop-loss once price exceeds it. Entries should be laddered in around the levels closest of the yellow line.
This trading strategy can be applied to any market and time frame, and positions most often garner the greatest risk-to-reward ratio with the highest success rate. What more can you ask for? I will only be posting my unique trading strategy until EOY. I work solely with price action to identify pennants and apply unique trend-based fibonacci retracement levels for SL and TP levels. Reach out to me if you have any questions.
Italian banks could go downThat is one of major banks in Italy. With ongoing drop of DAX SPY and emerging markets together with brexit and FED interest rate increase and USA-China trade war we are going to see some major drop and financial companies are first to feel it. Italian banks are already in deep trouble and very easy they could flip over.


