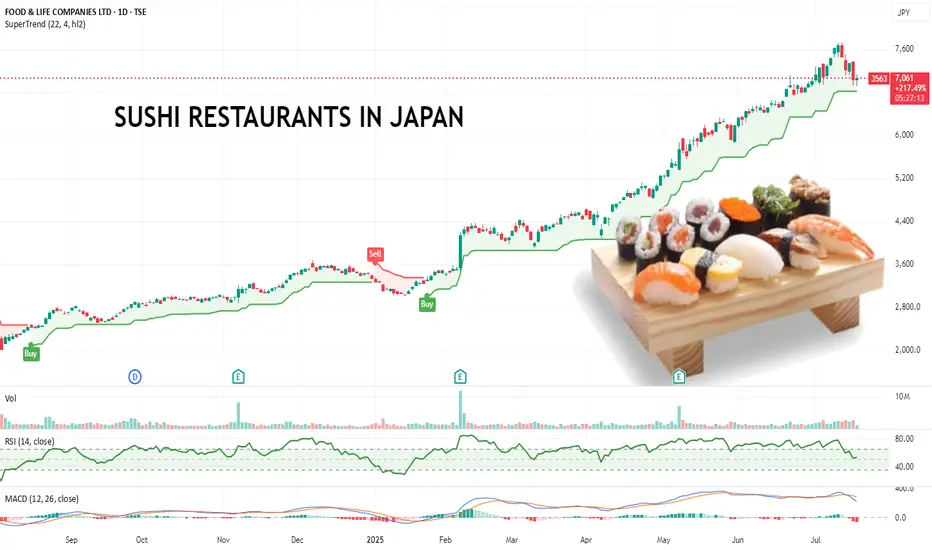
Pullback Over? This Japanese Sushi Chain Might Be Running Again.Food & Life Companies runs a major chain of sushi restaurants and is listed on the Tokyo Stock Exchange under the code 3563.TSE
From July 2025, I’ve started focusing more on scanning for high-momentum stocks globally, regardless of exchange. This one caught my eye with a clean, steady uptrend and a
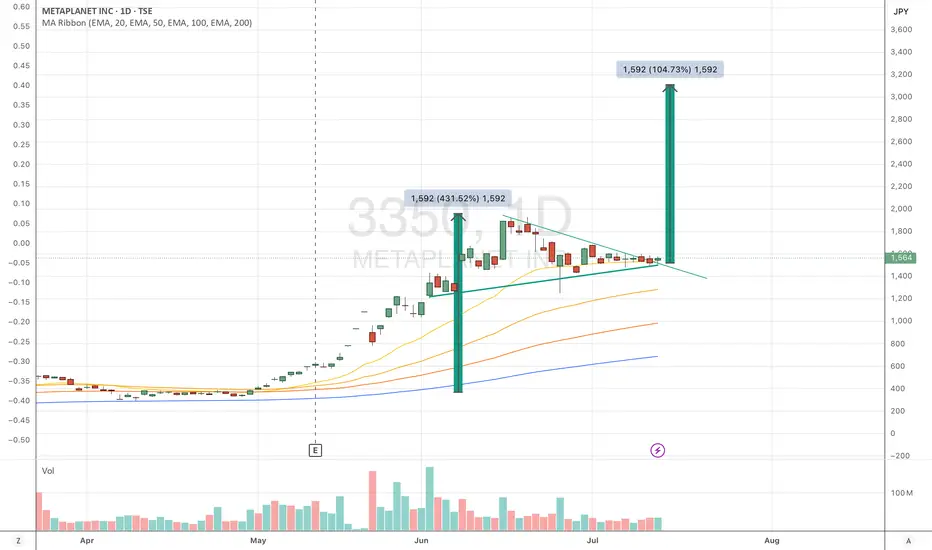
MTPLF, DN3, 3350 : End of week breakoutnice little pennant with a 3200 target this summer. without taking coming bitcoin surge into account.
Daikin - Bottom rebound likelyTSE:6367 Daikin is looking at a possible bullish reversal after consolidating for the past 4 Months since Feb 2025. Furthermore, buying pressure is seen and is validated by healthy expansion of volume. Currently the stock has gapped up on Monday and is likely to see a strong reversion to the upside

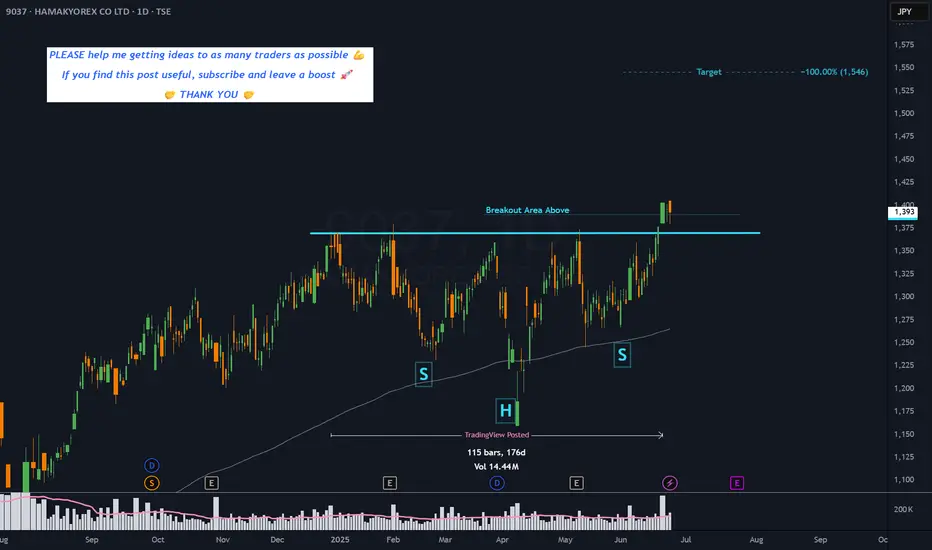
9037 - 6 months HEAD & SHOULDERS CONTINUATION══════════════════════════════
Since 2014, my markets approach is to spot
trading opportunities based solely on the
development of
CLASSICAL CHART PATTERNS
🤝Let’s learn and grow together 🤝
══════════════════════════════
Hello Traders ✌
After a careful consideration I came to the conclusion that:
-
Anycolor Inc Trade IdeaShowing strong momentum after a breakout to new all-time highs, driven by robust growth in its VTuber business and digital content ecosystem. The company just reported a 34% YoY revenue increase to ¥42.9 billion and a 31.7% rise in operating profit for FY2025, fueled by expansion in both its domesti

Will Nissan be saved from Bankruptcy?Financial Health & Bankruptcy Risks
Credit ratings in junk territory
Moody’s recently downgraded Nissan’s credit rating to Ba2 (negative outlook), highlighting weak free cash flow and margins. S&P and Fitch have also downgraded Nissan to below investment‑grade with negative outlooks.
Massive

IZUMI wait for breaktout 2XBuy gradually from here or wait for breaking through this resistance line with a short-term target of at least 10%+.

Tokyo Electron Stock Chart Fibonacci Analysis 042825Trading Idea
1) Find a FIBO slingshot
2) Check FIBO 61.80% level
3) Entry Point > 21,510/61.80%
Chart time frame:D
A) 15 min(1W-3M)
B) 1 hr(3M-6M)
C) 4 hr(6M-1year)
D) 1 day(1-3years)
Stock progress: B
A) Keep rising over 61.80% resistance
B) 61.80% resistance
C) 61.80% support
D) Hit the botto

Bullish on Toyota, Buy when confirmation hitsToyota is a huge company with it's earnings reports as of late picking up massive steam, since this whole Tariff debacle It is only clearly apparent that the stock is ready to rebound after a long period of bearish behavior, once we reach the confirmation line we can say for certain that Toyota is o

Upwards trend and over 8 millionen copys of MHW soldThe company has great IPs like Dragons Dogma, Resident Evil, Street Fighter and of course the Monster Hunter games. There last games were a huge success with yet sold over 8 million copys of monster hunter wilds since release. Besides that the other AAA gaming companys are completly getting destroye

See all popular ideas
Community trends
Stock collections
All stocksTop gainersBiggest losersLarge-capSmall-capLargest employersHigh-dividendHighest net incomeHighest cashHighest profit per employeeHighest revenue per employeeMost activeUnusual volumeMost volatileHigh betaBest performingHighest revenueMost expensivePenny stocksOverboughtOversoldAll-time highAll-time low52-week high52-week lowSee all
Today
6578CORREC HOLDINGS INC
Actual
—
Estimate
—
Today
7463ADVAN GROUP CO LTD
Actual
—
Estimate
—
Today
3153YASHIMA DENKI CO LTD
Actual
—
Estimate
—
Tomorrow
6146DISCO CORPORATION
Actual
—
Estimate
226.18
JPY
Tomorrow
8887SYLA HOLDINGS CO LTD
Actual
—
Estimate
—
Jul 18
5423TOKYO STEEL MANUFACTURING CO
Actual
—
Estimate
—
Jul 18
4929ADJUVANT HOLDINGS CO LTD
Actual
—
Estimate
—
Jul 18
2411GENDAI AGENCY INC
Actual
—
Estimate
—
See more events
Sector 10 matches | Today | 1 week | 1 month | 6 months | Year to date | 1 year | 5 years | 10 years |
|---|---|---|---|---|---|---|---|---|
| Finance | ||||||||
| Producer Manufacturing | ||||||||
| Consumer Durables | ||||||||
| Electronic Technology | ||||||||
| Technology Services | ||||||||
| Health Technology | ||||||||
| Retail Trade | ||||||||
| Process Industries | ||||||||
| Communications | ||||||||
| Consumer Non-Durables |