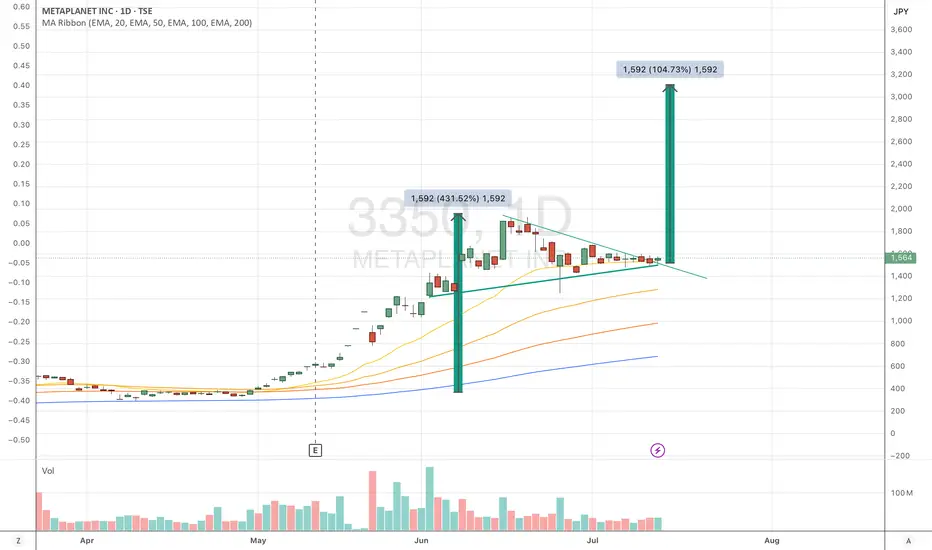
MTPLF, DN3, 3350 : End of week breakoutnice little pennant with a 3200 target this summer. without taking coming bitcoin surge into account.
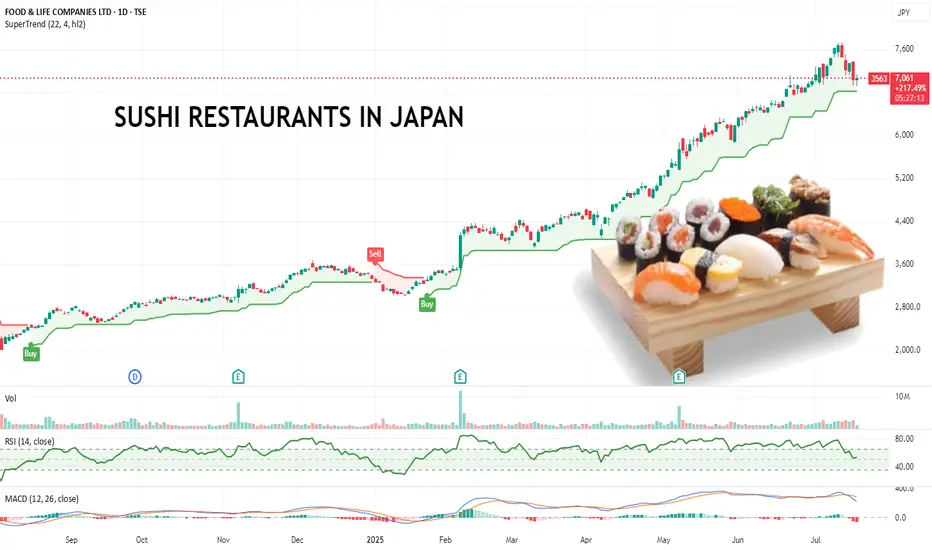
Pullback Over? This Japanese Sushi Chain Might Be Running Again.Food & Life Companies runs a major chain of sushi restaurants and is listed on the Tokyo Stock Exchange under the code 3563.TSE
From July 2025, I’ve started focusing more on scanning for high-momentum stocks globally, regardless of exchange. This one caught my eye with a clean, steady uptrend and a strong 200% move over the past year with minimal deep pullbacks.
It recently dipped, found support, and looks like it’s picking up again. That kind of price action gives a clear structure for managing risk if it rolls over. Makes it easy to identify where to put a stop loss to manage risk.
Also worth noting they’re aggressively expanding into Southeast Asia and beyond, which could help sustain the growth story.
Also. I like sushi. Wonder if there is a kebab stock...
Anyway, might be worth a watch.
Daikin - Bottom rebound likelyTSE:6367 Daikin is looking at a possible bullish reversal after consolidating for the past 4 Months since Feb 2025. Furthermore, buying pressure is seen and is validated by healthy expansion of volume. Currently the stock has gapped up on Monday and is likely to see a strong reversion to the upside targeting 20,000 in the mid-term. Price action wise, the bear trap is valid after rebounding from the low of 14,920, which is less around 6% from its previous low at 15,790.
Long-term MACD is looking at a steady bullish momentum after histogram turns positive and stochastic oscillator has been rising steadily.

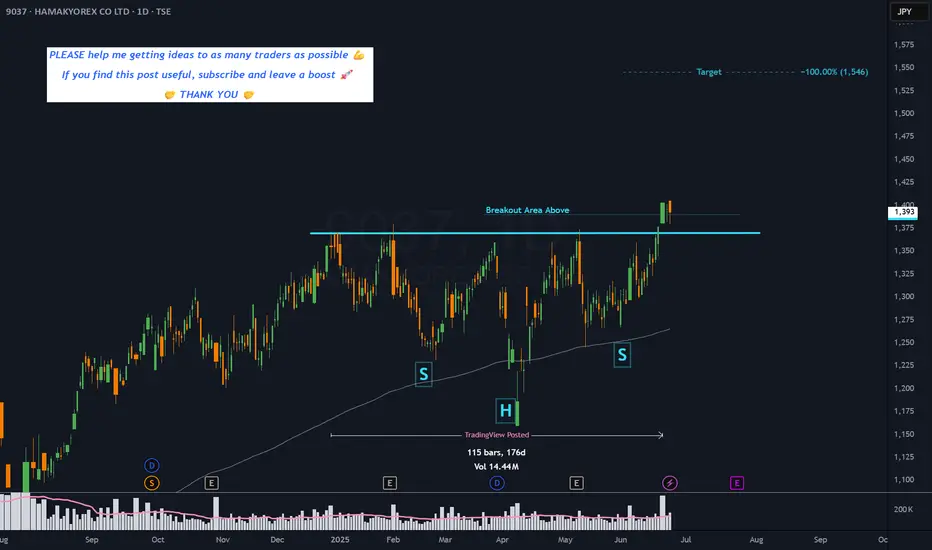
9037 - 6 months HEAD & SHOULDERS CONTINUATION══════════════════════════════
Since 2014, my markets approach is to spot
trading opportunities based solely on the
development of
CLASSICAL CHART PATTERNS
🤝Let’s learn and grow together 🤝
══════════════════════════════
Hello Traders ✌
After a careful consideration I came to the conclusion that:
- it is crucial to be quick in alerting you with all the opportunities I spot and often I don't post a good pattern because I don't have the opportunity to write down a proper didactical comment;
- since my parameters to identify a Classical Pattern and its scenario are very well defined, many of my comments were and would be redundant;
- the information that I think is important is very simple and can easily be understood just by looking at charts;
For these reasons and hoping to give you a better help, I decided to write comments only when something very specific or interesting shows up, otherwise all the information is shown on the chart.
Thank you all for your support
🔎🔎🔎 ALWAYS REMEMBER
"A pattern IS NOT a Pattern until the breakout is completed. Before that moment it is just a bunch of colorful candlesticks on a chart of your watchlist"
═════════════════════════════
⚠ DISCLAIMER ⚠
Breakout Area, Target, Levels, each line drawn on this chart and any other content represent just The Art Of Charting’s personal opinion and it is posted purely for educational purposes. Therefore it must not be taken as a direct or indirect investing recommendations or advices. Entry Point, Initial Stop Loss and Targets depend on your personal and unique Trading Plan Tactics and Money Management rules, Any action taken upon these information is at your own risk.
═════════════════════════════
Anycolor Inc Trade IdeaShowing strong momentum after a breakout to new all-time highs, driven by robust growth in its VTuber business and digital content ecosystem. The company just reported a 34% YoY revenue increase to ¥42.9 billion and a 31.7% rise in operating profit for FY2025, fueled by expansion in both its domestic and global VTuber operations, particularly through the “Nijisanji” brand
Catalyst: Ongoing innovation, global expansion, and increasing monetization per VTuber are set to drive further earnings surprises and upside momentum.

Will Nissan be saved from Bankruptcy?Financial Health & Bankruptcy Risks
Credit ratings in junk territory
Moody’s recently downgraded Nissan’s credit rating to Ba2 (negative outlook), highlighting weak free cash flow and margins. S&P and Fitch have also downgraded Nissan to below investment‑grade with negative outlooks.
Massive restructuring and heavy losses
Nissan recorded a loss between ¥700–750 billion (~$4.9–5.3 billion) for the fiscal year ending March 2025. It is slashing workforce by 20,000 jobs (15% of staff) and closing plants—cost cuts totaling ¥500 billion (~€4 billion) .
Bankruptcy probability contradictory
Macroaxis data shows an 80%+ distress probability, indicating severe risk. In contrast, another analysis cites a much lower 4.7% bankruptcy chance but flags poor solvency and weak interest coverage.
Turnaround Plans & Potential Lifelines
Re:Nissan turnaround strategy
Under new CEO Ivan Espinosa, Nissan is executing an aggressive plan: job cuts, plant closures, and restructuring. He’s also refocusing on EVs, hybrids, and partnerships.
Merger or investment hopes
Talks with Honda aimed at a mega-merger failed, though discussions remain open. Possibility of seeking anchor investors or strategic partnerships (some even speculating interest from the likes of Tesla or Foxconn), though none are confirmed .
Investor Outlook: Why Nissan Is Risky
High financial leverage: Junk ratings signal difficulty in accessing capital and higher borrowing costs.
Execution risk: Massive cuts and restructuring can be disruptive and slow to turn into profitability.
Industry headwinds: The shift to EVs and hybrids is accelerating—Nissan’s lineup has lagged behind competitors.
Geopolitical threat: Tariffs (especially on Mexico-made vehicles) could further squeeze margins
-Disclaimer: This analysis is for informational and educational purposes only and does not constitute financial advice, investment recommendation, or an offer to buy or sell any securities. Stock prices, valuations, and performance metrics are subject to change and may be outdated. Always conduct your own due diligence and consult with a licensed financial advisor before making investment decisions. The information presented may contain inaccuracies and should not be solely relied upon for financial decisions. I am not personally liable for your own losses, this is not financial advise.

Larger correction wave is likely completedTSE:6526 is looking at a strong possible bullish reversal as the stock has seen a possible end of its corrective structure. Furthermore, there is a v-shaped bottom reversal forming and given the strong momentum, the stock is likely to break above the neckline resistance of 2,371. We expect 1st target to reach 3,612.
Long-term MACD is positive and shows strong momentum. Stochastic Oscillator has rose beyond the mid-point level and 23-period ROC is strong. Directional movement index reiterates the strong bullish strength.

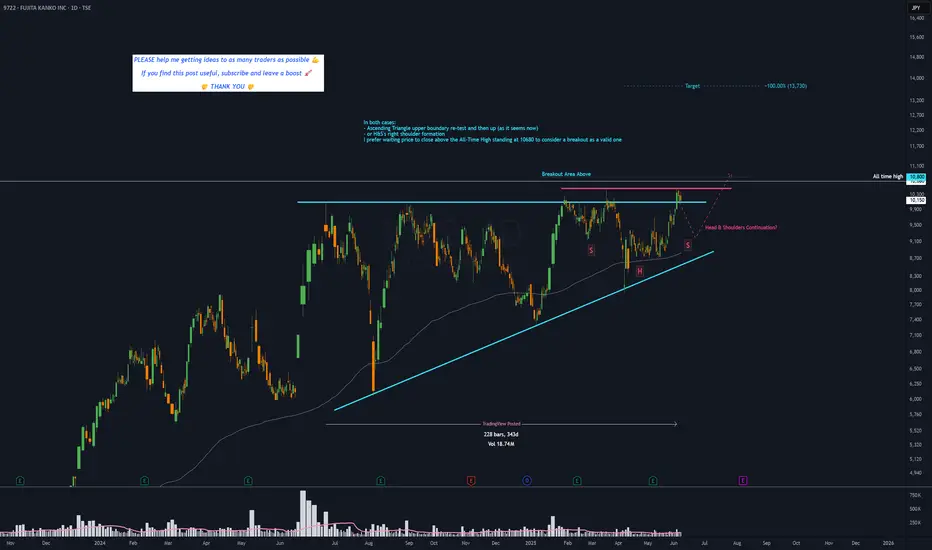
9722 - 11 months ASCENDING TRIANGLE══════════════════════════════
Since 2014, my markets approach is to spot
trading opportunities based solely on the
development of
CLASSICAL CHART PATTERNS
🤝Let’s learn and grow together 🤝
══════════════════════════════
Hello Traders ✌
After a careful consideration I came to the conclusion that:
- it is crucial to be quick in alerting you with all the opportunities I spot and often I don't post a good pattern because I don't have the opportunity to write down a proper didactical comment;
- since my parameters to identify a Classical Pattern and its scenario are very well defined, many of my comments were and would be redundant;
- the information that I think is important is very simple and can easily be understood just by looking at charts;
For these reasons and hoping to give you a better help, I decided to write comments only when something very specific or interesting shows up, otherwise all the information is shown on the chart.
Thank you all for your support
🔎🔎🔎 ALWAYS REMEMBER
"A pattern IS NOT a Pattern until the breakout is completed. Before that moment it is just a bunch of colorful candlesticks on a chart of your watchlist"
═════════════════════════════
⚠ DISCLAIMER ⚠
Breakout Area, Target, Levels, each line drawn on this chart and any other content represent just The Art Of Charting’s personal opinion and it is posted purely for educational purposes. Therefore it must not be taken as a direct or indirect investing recommendations or advices. Entry Point, Initial Stop Loss and Targets depend on your personal and unique Trading Plan Tactics and Money Management rules, Any action taken upon these information is at your own risk.
═════════════════════════════
IZUMI wait for breaktout 2XBuy gradually from here or wait for breaking through this resistance line with a short-term target of at least 10%+.

Tokyo Electron Stock Chart Fibonacci Analysis 042825Trading Idea
1) Find a FIBO slingshot
2) Check FIBO 61.80% level
3) Entry Point > 21,510/61.80%
Chart time frame:D
A) 15 min(1W-3M)
B) 1 hr(3M-6M)
C) 4 hr(6M-1year)
D) 1 day(1-3years)
Stock progress: B
A) Keep rising over 61.80% resistance
B) 61.80% resistance
C) 61.80% support
D) Hit the bottom
E) Hit the top
Stocks rise as they rise from support and fall from resistance. Our goal is to find a low support point and enter. It can be referred to as buying at the pullback point. The pullback point can be found with a Fibonacci extension of 61.80%. This is a step to find entry level. 1) Find a triangle (Fibonacci Speed Fan Line) that connects the high (resistance) and low (support) points of the stock in progress, where it is continuously expressed as a Slingshot, 2) and create a Fibonacci extension level for the first rising wave from the start point of slingshot pattern.
When the current price goes over 61.80% level , that can be a good entry point, especially if the SMA 100 and 200 curves are gathered together at 61.80%, it is a very good entry point.
As a great help, tradingview provides these Fibonacci speed fan lines and extension levels with ease. So if you use the Fibonacci fan line, the extension level, and the SMA 100/200 curve well, you can find an entry point for the stock market. At least you have to enter at this low point to avoid trading failure, and if you are skilled at entering this low point, with fibonacci6180 technique, your reading skill to chart will be greatly improved.
If you want to do day trading, please set the time frame to 5 minutes or 15 minutes, and you will see many of the low point of rising stocks.
If want to prefer long term range trading, you can set the time frame to 1 hr or 1 day.

Bullish on Toyota, Buy when confirmation hitsToyota is a huge company with it's earnings reports as of late picking up massive steam, since this whole Tariff debacle It is only clearly apparent that the stock is ready to rebound after a long period of bearish behavior, once we reach the confirmation line we can say for certain that Toyota is on sale and buying is a clear move

Inverted head and shoulder in placeTSE:7951 is looking at a potential reversal after the stock formed an inverted head and shoulder formation. Furthermore, the stock has broken above the bearish gap down zone, indicating renewed buying pressure.
Hence, we believe that the stock is likely to edge up higher after long-term MACD momentum is showing signs of return.
Weekly chart shows a larger completion of wave A and currently we may see another upside leg of wave B with target at 1614-1792

Upwards trend and over 8 millionen copys of MHW soldThe company has great IPs like Dragons Dogma, Resident Evil, Street Fighter and of course the Monster Hunter games. There last games were a huge success with yet sold over 8 million copys of monster hunter wilds since release. Besides that the other AAA gaming companys are completly getting destroyed chartwise, what makes capcom and even more shining star on the market.
Chartwise we have a nice upwards trend, with my bet on a good rise when the earnings are coming out.
Disclamer: I bought shares today and this is of course just my opinion.

Cycle leading indicatorPotential to buy up and short idea for market.
Apply for US stock or EU stock

DMG Mori looking at bullish continuation TSE:6141 DMG Mori is looking at a strong bullish upside after the stock has seen a strong reversal at the base of the channel. Looking at the weekly chart, the stock has been on a steady uptrend since 2013 and stock recent price action on the weekly chart also sees DMG being supported above the 200-EMA. 14-week period RSI saw rising momentum when the lows are rising higher. Descending corrective channel which started in Apr 2024 is likely to be a bullish flag.
Looking at the daily chart, the bullish rebound is kinda cemented after it closes above the bearish down gap. Furthermore, Ichimoku shows three bullish golden cross.
Long-term MACD is looking at a return of a long-term bullish momentum. Stochastic rose and this has confirmed the upside momentum and bullish oversold signal. Volume remain healthy.

6501 - 4 months RECTANGLE══════════════════════════════
Since 2014, my markets approach is to spot
trading opportunities based solely on the
development of
CLASSICAL CHART PATTERNS
🤝Let’s learn and grow together 🤝
══════════════════════════════
Hello Traders ✌
After a careful consideration I came to the conclusion that:
- it is crucial to be quick in alerting you with all the opportunities I spot and often I don't post a good pattern because I don't have the opportunity to write down a proper didactical comment;
- since my parameters to identify a Classical Pattern and its scenario are very well defined, many of my comments were and would be redundant;
- the information that I think is important is very simple and can easily be understood just by looking at charts;
For these reasons and hoping to give you a better help, I decided to write comments only when something very specific or interesting shows up, otherwise all the information is shown on the chart.
Thank you all for your support
🔎🔎🔎 ALWAYS REMEMBER
"A pattern IS NOT a Pattern until the breakout is completed. Before that moment it is just a bunch of colorful candlesticks on a chart of your watchlist"
═════════════════════════════
⚠ DISCLAIMER ⚠
Breakout Area, Target, Levels, each line drawn on this chart and any other content represent just The Art Of Charting’s personal opinion and it is posted purely for educational purposes. Therefore it must not be taken as a direct or indirect investing recommendations or advices. Entry Point, Initial Stop Loss and Targets depend on your personal and unique Trading Plan Tactics and Money Management rules, Any action taken upon these information is at your own risk.
═════════════════════════════

Typical chart pattern revealing institutional capital flow.This is a classic chart pattern that provides clear signals about how large investors enter and exit their positions.
Neither you nor I can pinpoint the exact bottom, but we can visualize a price zone referred to as the bottom range.
Here, we observe high trading volume, with price movements confined within a certain range. By analyzing volume, we can better understand how institutions accumulate and distribute their holdings.
I am not advising you to invest in any particular stock.
Investing always carries risks, and it's crucial to manage risk and allocate capital appropriately based on your personal circumstances.
Wishing you successful and profitable trades!

$5020.T ENEOS HOLDINGS: REVENUE GROWTH, MAJOR IPO ENEOS HOLDINGS: REVENUE GROWTH, MAJOR IPO & DECARBONIZATION STRATEGY
1/8
Big News: Eneos Holdings ($5020.T) reported ¥14.97T revenue for FY 2024 (+9.8% YoY) thanks to higher oil prices & solid refining demand. They’ve also announced a massive JX Advanced Metals ($JXAM) IPO worth up to ¥460B—Japan’s largest in 7 years! 🏭💥
2/8 – EARNINGS SNAPSHOT
• FY Net Income: ¥320.5B (↓12% YoY) due to rising costs & green investments 🌱⚡️
• Q3 Net Income: ¥85.4B (+3% QoQ) on cost optimization + refining margin boost
• Dividend: ¥22/share—they’re not skimping on shareholder returns 💹💰
3/8 – SIGNIFICANT FINANCIAL EVENTS
• JXAM IPO coming Mar 19, 2025—selling 50.1–58% stake
• Could raise $2.6– SEED_TVCODER77_ETHBTCDATA:3B —funding Eneos’ decarbonization pivot & fueling shareholder value 🚀
• Market reacted positively (+1% in Eneos stock), while broader Japanese market stayed flat ⚖️
4/8 – SECTOR COMPARISON
• Valuation: P/E ~8.5 vs. global oil refiners (~10.2) & metals (~12.1) 🔎
• Revenue Growth: +9.8% outpacing Shell (6.2%) & ExxonMobil NYSE:XOM (7.8%), but below BHP (12.4%)
• Undervalued? P/B ~0.9 vs. sector avg. 1.3, EV/EBITDA 6.8 vs. peers at 7.5. Looks attractive! 🔥
5/8 – RISK FACTORS
• Oil Price Volatility: Refining margins can flip on a dime ⛽️💥
• Geopolitical Tensions: Japan relies heavily on energy imports 🌏
• Energy Transition Costs: ¥150B budget for renewables—major capex needed ♻️🔋
• JXAM IPO Execution: A poor market reception = potential stock hit ⚠️
6/8 – REGULATORY & DECARBONIZATION
• Japan targets net-zero by 2050—Eneos faces higher compliance costs 🌐
• Carbon capture & hydrogen investments: Could future-proof Eneos, but short-term margins may tighten 🤖⚡️
7/8 – SWOT HIGHLIGHTS
• Strengths: Diversified (refining + metals + renewables), top-tier Japanese refiner 🏆
• Weaknesses: Profit margin (2.1%) lags peers, heavy capex for transition 😬
• Opportunities: JXAM IPO frees capital; renewables & hydrogen for growth 🌱💡
• Threats: Shift away from fossil fuels, market skepticism 🚫⚡️
8/8 Where do you see Eneos in 2025?
1️⃣ Bullish—Decarbonization + IPO = huge upside! 🐂
2️⃣ Cautiously Optimistic—Valuation looks good, but risks are real 🤔
3️⃣ Bearish—Oil refining can’t outrun global transitions 🐻
Vote below! 🗳️👇

Bullish continuation is in sight TSE:6677 SK electronics is looking at a possible continuation after 1.) It gapped up from immediate bottom and broke out of the falling wedge on good earnings. To add on, the stock's bullish momentum is back after long-term MACD rose from the bottom after it has perfromed a crossover. Histogram is positive. Stochastic confirmed the oversold crossover and 23-period ROC rose strongly.

Bottoming out with strong buying pressureTSE:5597 Blue innovation is looking at a strong bottoming out reversal as strong bullish pressure is seen breaking out of the 1-year downtrend line which started since Dec 2023. Furthermore, the long-term MACD has crossed below, in tandem with stochastic showing "Rising oversold crossover". 23-period ROC has also risen above the zero line.
Hence, mid-term target is at 1,362.

Resuming the upside momentumTSE:6862 is looking at a strong upside resumption after strong bullish marobozu enters the bearish gap resistance zone at 887-1025. Price action is strong as major uptrend remain intact since Maarch 2020 and secondary uptrend channel since August 2024 is sustaining well.
Ichimoku shows a strong bullish uptrend signal. Long-term MACD is showing sustained long-term upside momentum. Stochastic managed to stay elevated above the midpoint 50-level. 23-period ROC is rising above the zero line. Directional movement index shows strong bullish strength confirmation.
If there's a correction, 738 will the major support to watch for a rebound. long-term target is at 2,000

Bridgestone is looking at upside resumption TSE:5108 Bridgestone's major trend of 10 years has always been strong and recent correction which started in May 2024 seems to be finished after the stock has closed above the overhead resistance and downtrend line. Furthermore, the break above the key support turned resistance at 5,584 is strong, which sees a new high.
Momentum is back to the upside especially after the mid-term stochastic oscillator has confirmed the oversold crossover and the 23-period ROC has risen above. Additionally, the volume confirms the break up and Directional movement index suggest that the bullish strength is strong.
Ichimoku shows a clear bullish uptrend. Target over the mid-term will be at 6,400

Attempting a break to the upside despite forming a crawl wedgeTSE:5253 Maintain a buy for Cover as resistance has been weakened due to multiple testing. Momentum so far remains steady on the upside. Only risk is the corrective structure down to test the lower support.
