Toray Industries - Tokyo - 1 Hr sell trade Torey industries, Tokyo - 1 Hr sell trade will be about to trigger, as the stocks is in downtrend and underpeformer than tokyo index JP225.
Check the count as i am thinking of going to short within 1-3 days after confirmation in smaller time frame. Will see what happened next.

My Analyses On Toyota MotorFriends, please support my Free works by Following and Clicking LIKE Button .
Feel free to post your thoughts and charts here in comments, I'd love to see it.


my idea about sony CORPafter breaking the support line and making a pull back i think that the trend line oing short

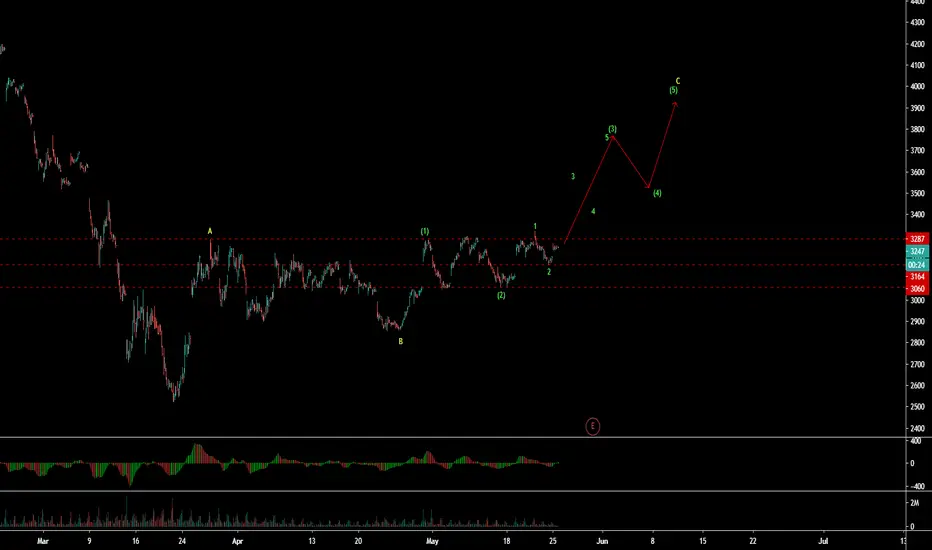
Head & Shoulders Bottome setup.Measuring objective and good confluence w/ previous value areas target 3560-3573.

Denka headed to fair value Denka Ltd. Is now at the 50% low-high level of recent Jan 2018 swing high (dashed red line / 3263). A rejection at these levels will target the longest line volume profile around 2,000.

Hitachi Ltd (6501 - Tokyo) - C wave upHitachi Ltd (6501 - Tokyo) is in Technology stock in Japan, which in WXY pattern in Weekly time frame from 2010 low and currently in Y wave up in ABC sequence. Price is in C wave up, which confirmed when it completes five wave sequence in smaller time frame say 60 min. In 30 min time frame it made A wave up followed by complex B wave. Now C wave up is in progress with 3 wave set up. Within this week the earning will be release after 4 days. 3293 is the level which is currently acting as resistance and once it will broke, price will be rallied so fast towards C up.

Mitsubishi UFJ Financial Group (8306 - Tokyo) - ABC wave patternMitsubishi UFJ Financial Group was in 4th wave triangle, which was over. It is in now 5th wave down which is only confirmed when triangle will broken down. This 5th wave is the part of C wave major down in daily time frame as ABC correction down. The better odd for this set up is that it’s under-performer to Nikkei index.

SojitzCorp (2768 - Tokyo) - Updated Elliottwave count
SojitzCorp (2768 - Tokyo) is 5th wave ending diagonal structure and progressing in overlapping wave sequence. It is better for pattern that it under-performed to Nikkei index.

long target 25000Buy
long position holds
first target 23500
second target 24200
third target 24700
final target 25000

Dentsu Group ( 4324 - Tokyo) - ABC wave pattern Dentsu Group ( 4324 - Tokyo) is in 5th of C wave down of Y wave in Weekly time frame from the top made in 2015. As shown in chart the 5th of 5th wave of C down is in progress after 4th wave completed in ABC correction. It is a huge under-performer to the market and easily made a new low if it retained the invalidation level (red line).

Amazing Oppy. for Huge GainsMacnica has more assets , after debt, than it's market cap is worth. You wont find a deal like this ever again.
Reports indicate good earnings results and outlook.
Trade at your own risk.

Mitsubishi UFJ Financial Group (8306 - Tokyo) - ABC wave patternMitsubishi UFJ Financial Group is in Y wave down in Daily time frame, which is moving down in ABC down as shown in chart. Impulse A down and B correction was already over. Price is now moving down in C wave. Wave 2 is in progress.

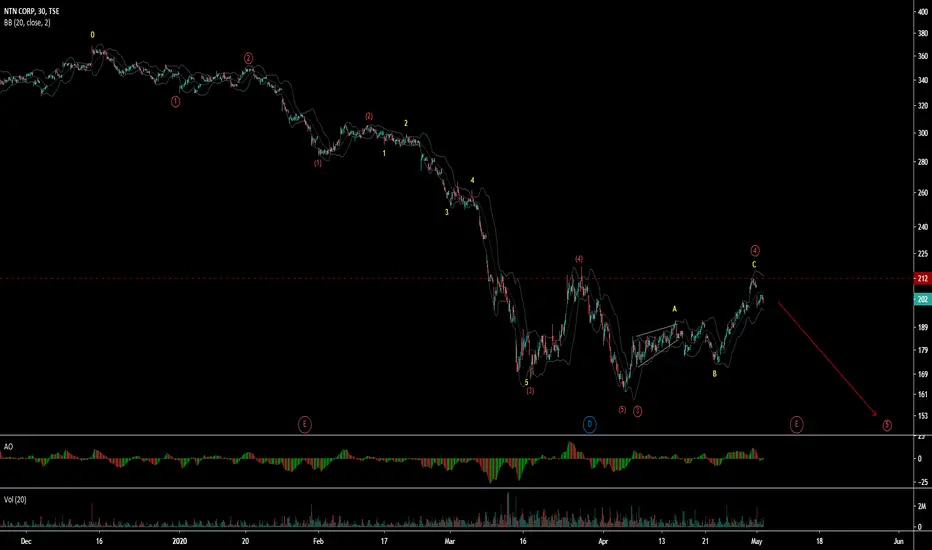
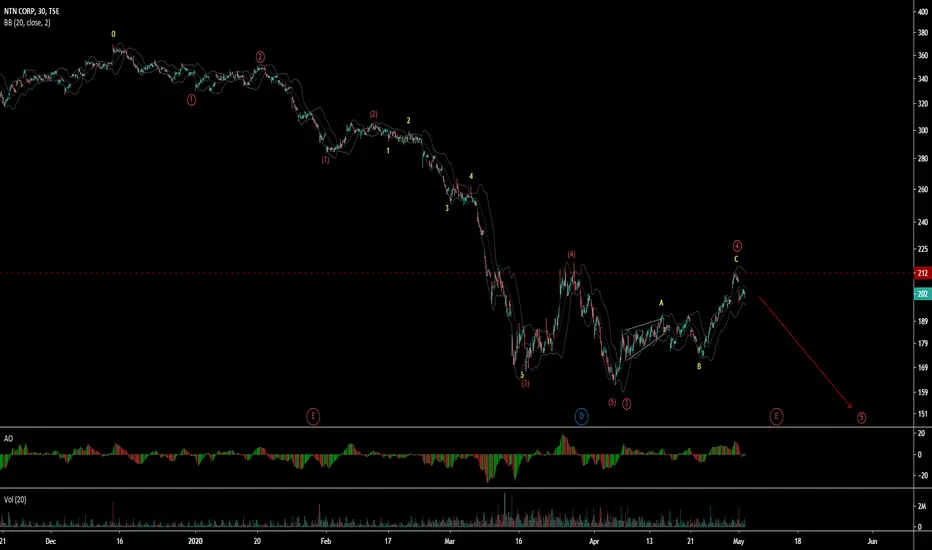
6472 (NTN Corp - Tokyo) 5th wave down6472 (NTN Corp - Tokyo) is in impulse down sequence, which completed its 4th zigzag wave. 5th wave down has already started which aims to targeted as new low below 164.
6472 (NTN Corp - Tokyo) 5th wave down6472 (NTN Corp - Tokyo) is in impulse down sequence, which completed its 4th zigzag wave. 5th wave down has already started which aims to targeted as new low below 164.
2768 (Sojitz Corp - Tokyo) 5th wave down2768 (Sojitz Corp - Tokyo) is in ABC zigzag down in daily time frame. It moving down now 5th of C wave down. Sell with low as target of C wave down after confirmation of trendline break or 5 wave down in smaller time frame.

3402 (Toray Industries - Tokyo) 5th wave down3402 (Toray Industries - Tokyo) is in ABC zigzag down in daily time frame. It moving down now 5th of C wave down. Good sell as its under-performing the index.

BEWARE FIRST & LAST SESSION HOUR- KDD CORPORATION-30MN- MY IDEASAfter a past long ranging period , we can observe that the KDD CORPORATION curve in 30mn has been at first descending.
After a short period with flat movement we observed a change in direction, seeing now the market going up back to the former ranging zone.
We see that there is a huge amount of fight between buyers and sellers. For the time being, buyers win!
Illustrated by two strong buying signals opportunity to get profits in the long direction.
Next:
-High probability of seeing the market running up more even in this slop angle.
- Beware of the first and last hour of session , major moves has been happening during those times.
- Possibility of a short entry around the top dotted black line which is a strong resistance point OR if we observe a large candlestick (one unique candlestick ) going down to break all lines and reshape the market.

RANGE BROKEN - BEARISH - TOYOTA MOTOR CORP - 30MN - MY IDEASAfter a long period ranging between the two blue lines (support/resistance), we are observing a break out in the downside.
The history of the market tells us that it has several times tried to revert with very strong volumes. ALL FAILED!
Until we had the confirmation of the downside trend.
What to look up next:
Check the volumes and see if it helps the market to revert the trend otherwise there is a high probability for the market to keep decreasing even if the slope have flatten a bit.

SONY CORP (6758) Two Scenarios!
hey guys,
sony is standing on a key structure resistance level!
depending on what is your bias on this stock you may either see an ascending triangle on 4H
or
a double top formation.
no matter what it is, we can trade the stock to both sides.
if the price breaks above resistance of the ascending formation,
for us, it will be a long signal and we buy expecting a continuation to higher scructure levels!
in contrast, 6600 is our minor support.
being broken to the downside, for us, it will be a trigger to short!
both scenarios are equally possible so be prepared!
good luck!


Toyota Tsushi breaking out of descending triangle, Moving HigherMoving higher on strong earnings results and continued dominance out of Japan. Strong balance sheet. Actually more than it's market cap.
Trade at your own risk.
