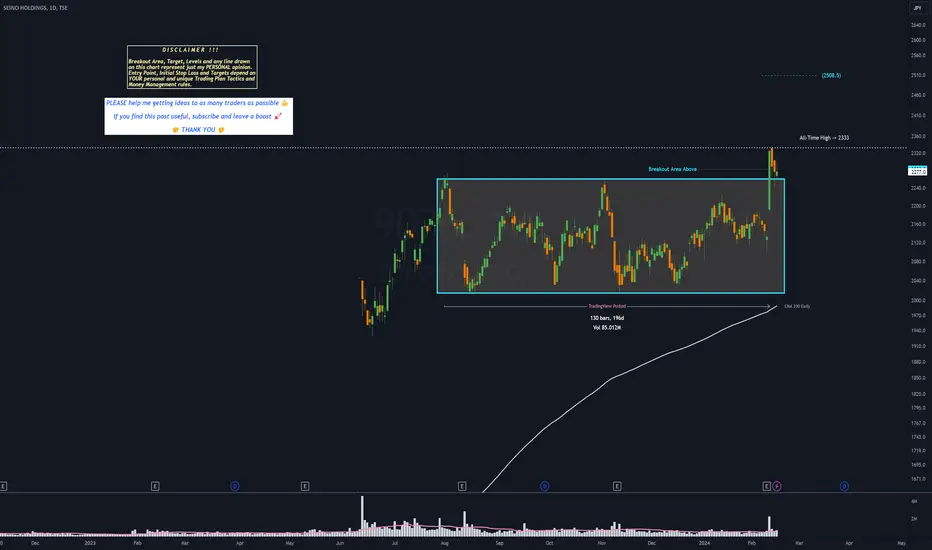
COMSYS Holdings, a Japanese stock, buying at 3227.The market is on uptrend and there is no Supply above. Right now this 4h Demand is the most tradable zone in the chart. This is a pretty wide zone, can be waiting to see if price go deeply into the zone for a better entry. Profit target should be at 3357

MONTH GARTLEYes.tradingview.com
GARTLEY MONTH, I thing that sell time is coming, but it takes time for taking a profit because this is a month timeframe.


9532 bullish As the chart shows - I've entered a stop order and will be long if the trendline breaks.

Mitsui & Co., Ltd.: Navigating Trade OpportunitiesHello,
Introduction:
In the dynamic world of global trade, Mitsui & Co., Ltd. stands as a stalwart in the general trading business. With a diverse portfolio spanning various sectors, the company is catching the attention of investors as it charts a promising course. In this analysis, we explore Mitsui's recent market movements and identify potential opportunities for traders.
Market Overview:
Mitsui & Co., Ltd. operates across multiple segments, including Iron & Steel Products, Mineral & Metal Resources, Machinery & Infrastructure, Chemicals, Energy, Lifestyle, Innovation & Corporate Development, and Others. This diverse portfolio positions the company as a key player in the global marketplace, contributing to its resilience and adaptability.
Technical Analysis:
One compelling aspect drawing attention is the formation of a bullish channel, resembling a flag pattern on the price chart. The channel indicates a potential upward trend, signaling a favorable opportunity for traders. The current buy setup suggests an entry point at 4920 JPY, with the first target set at 5788 JPY.
Bullish Flag Formation:
The flag pattern is a technical analysis tool used to identify continuation patterns in a trend. In Mitsui's case, the formation of a bullish flag within the price chart implies that the previous upward trend may resume. This pattern is characterized by a brief consolidation, represented by the flag, followed by a potential breakout in the direction of the prevailing trend.
Trade Strategy:
For traders eyeing an entry into Mitsui & Co., Ltd., the suggested buy area at 4920 JPY serves as a strategic starting point. This price level aligns with the lower boundary of the bullish channel, offering a favorable risk-reward ratio.
The first target set at 5788 JPY represents a potential price objective based on the continuation of the bullish trend. Traders should monitor the price action closely, with a keen eye on any potential breakout from the flag pattern.
Risk Management:
While the bullish outlook is promising, it's essential for investors to implement robust risk management strategies. Setting stop-loss orders at appropriate levels can help mitigate potential losses in the event of an unexpected market reversal.
Conclusion:
Mitsui & Co., Ltd. presents an intriguing opportunity for traders as it forms a bullish flag within its price chart. With a diverse business portfolio and a strong market presence, the company's upward potential is underscored by technical analysis. Traders considering a position in Mitsui should carefully evaluate the risk-reward dynamics and stay vigilant for any developments that may impact the trade. As always, informed decision-making and prudent risk management remain essential in navigating the dynamic landscape of financial markets.
Good Luck!!

SUGI Bullish SetupThe asset has arrived at a great Load-zone currently below its Resistance labeled as R1. The Bullish crab pattern is indicating the potential for a swing to the following targets in case of a breakout over R1.
Ni225 Long-term analysis below is now also showing us a minor bullish pullback is in play on the Japanese index on lower time frames.

Earth Infinity Stock of TSEWait the dump and buy. A Stock to hold over 1000% in the next Year.
No SL, no Risk buy not more than 2% of your Accountvalue.
Wait the ATH arount 800 JPY. A Stock to hold longer.

9076 - 7 months RECTANGLE══════════════════════════════
Since 2014, my markets approach is to spot
trading opportunities based solely on the
development of
CLASSICAL CHART PATTERNS
🤝Let’s learn and grow together 🤝
══════════════════════════════
Hello Traders ✌
After a careful consideration I came to the conclusion that:
- it is crucial to be quick in alerting you with all the opportunities I spot and often I don't post a good pattern because I don't have the opportunity to write down a proper didactical comment;
- since my parameters to identify a Classical Pattern and its scenario are very well defined, many of my comments were and would be redundant;
- the information that I think is important is very simple and can easily be understood just by looking at charts;
For these reasons and hoping to give you a better help, I decided to write comments only when something very specific or interesting shows up, otherwise all the information is shown on the chart.
Thank you all for your support
🔎🔎🔎 ALWAYS REMEMBER
"A pattern IS NOT a Pattern until the breakout is completed. Before that moment it is just a bunch of colorful candlesticks on a chart of your watchlist"
═════════════════════════════
⚠ DISCLAIMER ⚠
The content is The Art Of Charting's personal opinion and it is posted purely for educational purpose and therefore it must not be taken as a direct or indirect investing recommendations or advices. Any action taken upon these information is at your own risk.
5976 - 7 months RECTANGLE══════════════════════════════
Since 2014, my markets approach is to spot
trading opportunities based solely on the
development of
CLASSICAL CHART PATTERNS
🤝Let’s learn and grow together 🤝
══════════════════════════════
Hello Traders ✌
After a careful consideration I came to the conclusion that:
- it is crucial to be quick in alerting you with all the opportunities I spot and often I don't post a good pattern because I don't have the opportunity to write down a proper didactical comment;
- since my parameters to identify a Classical Pattern and its scenario are very well defined, many of my comments were and would be redundant;
- the information that I think is important is very simple and can easily be understood just by looking at charts;
For these reasons and hoping to give you a better help, I decided to write comments only when something very specific or interesting shows up, otherwise all the information is shown on the chart.
Thank you all for your support
🔎🔎🔎 ALWAYS REMEMBER
"A pattern IS NOT a Pattern until the breakout is completed. Before that moment it is just a bunch of colorful candlesticks on a chart of your watchlist"
═════════════════════════════
⚠ DISCLAIMER ⚠
The content is The Art Of Charting's personal opinion and it is posted purely for educational purpose and therefore it must not be taken as a direct or indirect investing recommendations or advices. Any action taken upon these information is at your own risk.

Trying to compare the performance of public watch companies ... Trying to compare the performance of public watch companies ... apple, xiomi, garmin, ralph lauren, lvmh, kering and hermes excluded because they produce others products that have higher total % revenue income ...

4507 (Shionogi & Co.)Shionogi & Company, Limited is a Japanese pharmaceutical company best known for developing Crestor. Medical supply and brand name also uses katakana. Shionogi has business roots that date back to 1878, and was incorporated in 1919.
Matching structure.

Will Toyota reach 3335 by April 2024?Daily chart, the stock crossed the channel upwards and the target is 3335
However, this stock is bouncing and has price gaps all the time! So, be careful with a near stop loss / profit protection level.
Current stop loss level is below 2890

Nissan Motors Long ScenarioI think it will be bullish til 2026. A stock I might just buy til then.! Price is in the manipulation area(quad 2/green box), where it showed false sell run as price ran it within the next 3 years. If price make it to (quad 3/blue zone) bullish; thats the confirmation to upside. Will Come back to this after a while.

6201 (Toyota Industries Corporation)Toyota Industries Corporation is a Japanese machine maker. Originally, and still actively, a manufacturer of automatic looms, it is the company from which Toyota Motor Corporation developed. It is the world's largest manufacturer of forklift trucks measured by revenues.
Potential breakout + volume

4063 (Shin Etsu Chmical)Shin-Etsu Chemical Co., Ltd. is the largest chemical company in Japan, ranked No. 9 in Forbes Global 2000 for chemical sector. Shin-Etsu has the largest global market share for polyvinyl chloride, semiconductor silicon, and photomask substrates.
Potential breakout from a consolidation range.

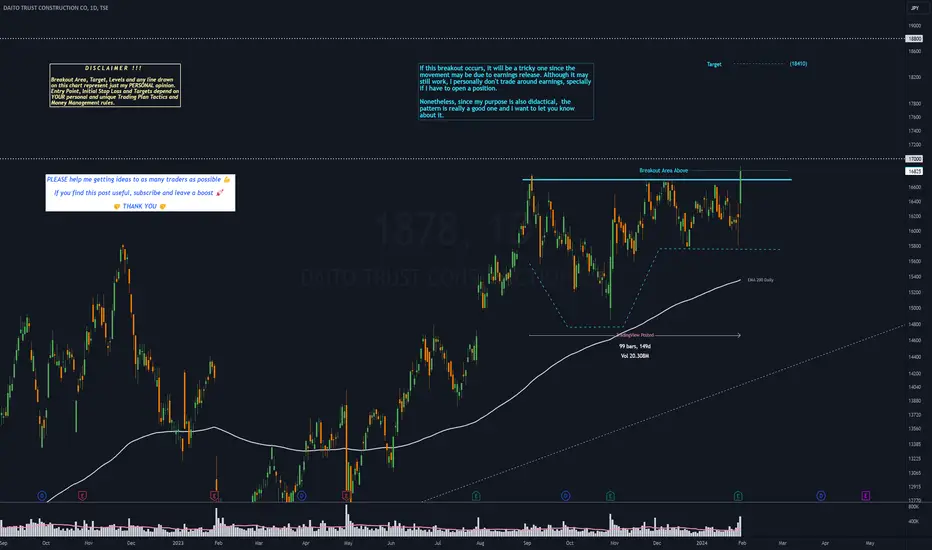
1878 - 5 months CUP & HANDLE══════════════════════════════
Since 2014, my markets approach is to spot
trading opportunities based solely on the
development of
CLASSICAL CHART PATTERNS
🤝Let’s learn and grow together 🤝
══════════════════════════════
Hello Traders ✌
After a careful consideration I came to the conclusion that:
- it is crucial to be quick in alerting you with all the opportunities I spot and often I don't post a good pattern because I don't have the opportunity to write down a proper didactical comment;
- since my parameters to identify a Classical Pattern and its scenario are very well defined, many of my comments were and would be redundant;
- the information that I think is important is very simple and can easily be understood just by looking at charts;
For these reasons and hoping to give you a better help, I decided to write comments only when something very specific or interesting shows up, otherwise all the information is shown on the chart.
Thank you all for your support
🔎🔎🔎 ALWAYS REMEMBER
"A pattern IS NOT a Pattern until the breakout is completed. Before that moment it is just a bunch of colorful candlesticks on a chart of your watchlist"
═════════════════════════════
⚠ DISCLAIMER ⚠
The content is The Art Of Charting's personal opinion and it is posted purely for educational purpose and therefore it must not be taken as a direct or indirect investing recommendations or advices. Any action taken upon these information is at your own risk.
7261 - 4 months SYMMETRICAL TRIANGLE══════════════════════════════
Since 2014, my markets approach is to spot
trading opportunities based solely on the
development of
CLASSICAL CHART PATTERNS
🤝Let’s learn and grow together 🤝
══════════════════════════════
Hello Traders ✌
After a careful consideration I came to the conclusion that:
- it is crucial to be quick in alerting you with all the opportunities I spot and often I don't post a good pattern because I don't have the opportunity to write down a proper didactical comment;
- since my parameters to identify a Classical Pattern and its scenario are very well defined, many of my comments were and would be redundant;
- the information that I think is important is very simple and can easily be understood just by looking at charts;
For these reasons and hoping to give you a better help, I decided to write comments only when something very specific or interesting shows up, otherwise all the information is shown on the chart.
Thank you all for your support
🔎🔎🔎 ALWAYS REMEMBER
"A pattern IS NOT a Pattern until the breakout is completed. Before that moment it is just a bunch of colorful candlesticks on a chart of your watchlist"
═════════════════════════════
⚠ DISCLAIMER ⚠
The content is The Art Of Charting's personal opinion and it is posted purely for educational purpose and therefore it must not be taken as a direct or indirect investing recommendations or advices. Any action taken upon these information is at your own risk.

8306 (Mitsubishi UFJ Financial Group)Mitsubishi UFJ Financial Group, Inc. is a Japanese bank holding and financial services company headquartered in Chiyoda, Tokyo, Japan. It is Japan's largest financial group and the world's second largest bank holding company holding around US$1.8 trillion in deposits as of March 2011.
Clean consolidation. Next leg up?

8308 (Resona Holdings)Resona Holdings, Inc. is the holding company of Resona Group, the fifth-largest banking group in Japan as of 2012. It is headquartered in the Kiba area of Koto, Tokyo.
Continuation buy/long.

7203 - 4 months RECTANGLE══════════════════════════════
Since 2014, my markets approach is to spot
trading opportunities based solely on the
development of
CLASSICAL CHART PATTERNS
🤝Let’s learn and grow together 🤝
══════════════════════════════
Hello Traders ✌
After a careful consideration I came to the conclusion that:
- it is crucial to be quick in alerting you with all the opportunities I spot and often I don't post a good pattern because I don't have the opportunity to write down a proper didactical comment;
- since my parameters to identify a Classical Pattern and its scenario are very well defined, many of my comments were and would be redundant;
- the information that I think is important is very simple and can easily be understood just by looking at charts;
For these reasons and hoping to give you a better help, I decided to write comments only when something very specific or interesting shows up, otherwise all the information is shown on the chart.
Thank you all for your support
🔎🔎🔎 ALWAYS REMEMBER
"A pattern IS NOT a Pattern until the breakout is completed. Before that moment it is just a bunch of colorful candlesticks on a chart of your watchlist"
═════════════════════════════
⚠ DISCLAIMER ⚠
The content is The Art Of Charting's personal opinion and it is posted purely for educational purpose and therefore it must not be taken as a direct or indirect investing recommendations or advices. Any action taken upon these information is at your own risk.

7203 (Toyota Motor Corp)Toyota Motor Corporation is a Japanese multinational automotive manufacturer headquartered in Toyota City, Aichi, Japan. It was founded by Kiichiro Toyoda and incorporated on August 28, 1937. Toyota is the largest automobile manufacturer in the world, producing about 10 million vehicles per year.
Triple Tops: Not always a bad thing...

8031 - 7 months RECTANGLE══════════════════════════════
Since 2014, my markets approach is to spot
trading opportunities based solely on the
development of
CLASSICAL CHART PATTERNS
🤝Let’s learn and grow together 🤝
══════════════════════════════
Hello Traders ✌
After a careful consideration I came to the conclusion that:
- it is crucial to be quick in alerting you with all the opportunities I spot and often I don't post a good pattern because I don't have the opportunity to write down a proper didactical comment;
- since my parameters to identify a Classical Pattern and its scenario are very well defined, many of my comments were and would be redundant;
- the information that I think is important is very simple and can easily be understood just by looking at charts;
For these reasons and hoping to give you a better help, I decided to write comments only when something very specific or interesting shows up, otherwise all the information is shown on the chart.
Thank you all for your support
🔎🔎🔎 ALWAYS REMEMBER
"A pattern IS NOT a Pattern until the breakout is completed. Before that moment it is just a bunch of colorful candlesticks on a chart of your watchlist"
═════════════════════════════
⚠ DISCLAIMER ⚠
The content is The Art Of Charting's personal opinion and it is posted purely for educational purpose and therefore it must not be taken as a direct or indirect investing recommendations or advices. Any action taken upon these information is at your own risk.

1606 (Inpex Corp)INPEX Corporation is a Japanese oil company established in February 1966 as North Sumatra Offshore Petroleum Exploration Co., Ltd. INPEX is the largest oil and gas exploration and production company in Japan, with global exploration, development and production projects in 20 countries.
Continuation buy/long.
