
Double Bottom + Bullish DivergenceDouble Bottom Formation on Weekly basis.
Bullish Divergence appeared.
Crossing & Sustaining 25 may lead it towards 26 - 27
& then around 33 - 34.
However, it should not break 21.90

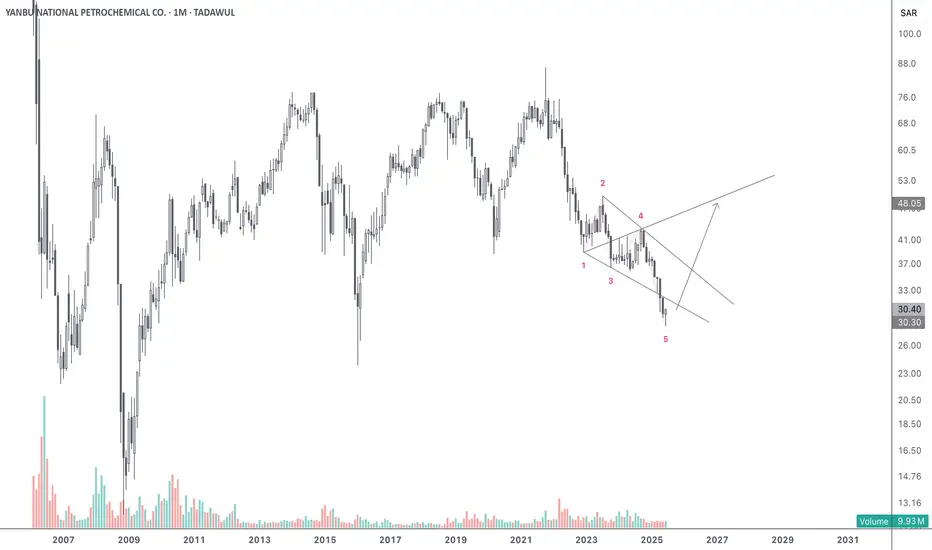
2290 Bullish Wolfe WaveA clean bullish Wolfe Wave setup is emerging, with price action completing the fifth wave just outside the channel – a typical trap zone before reversal.
Wave 5 shows early signs of a bullish reaction, suggesting a potential move toward the target line drawn from points (1) to (4).
4040 Reversal candle at key trendline resistanceA significant monthly reversal candlestick has formed right at the long-term descending trendline, supported by historical price action.

SAUDI TELECOM CO.If you like my Idea, Don't forget to Boost and comment on my Analysis. The recommendations are purely for educational purpose only, consult you financial advisor before trading.

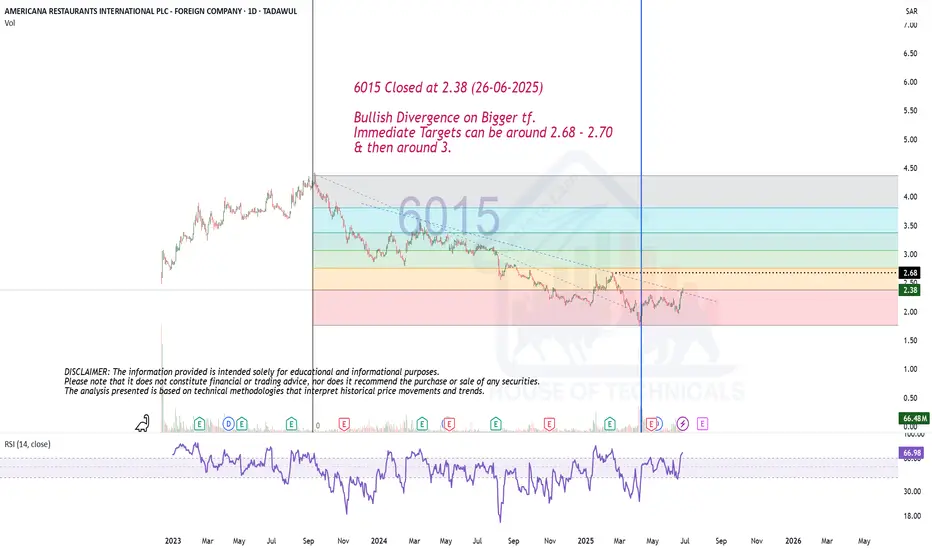
Bullish Divergence on Bigger tf.6015 Closed at 2.38 (26-06-2025)
Bullish Divergence on Bigger tf.
Immediate Targets can be around 2.68 - 2.70
& then around 3.
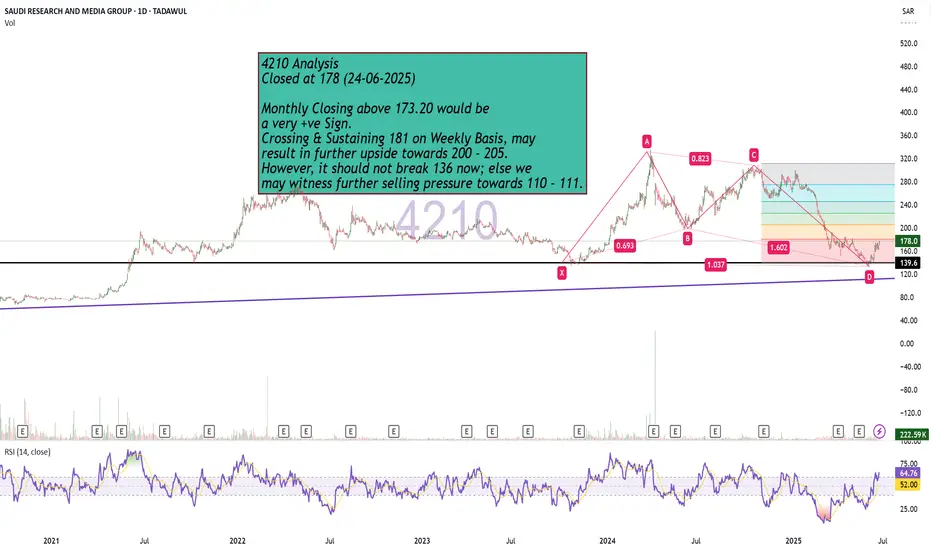
Bullish Monthly Candle Expected?4210 Analysis
Closed at 178 (24-06-2025)
Monthly Closing above 173.20 would be
a very +ve Sign.
Crossing & Sustaining 181 on Weekly Basis, may
result in further upside towards 200 - 205.
However, it should not break 136 now; else we
may witness further selling pressure towards 110 - 111.

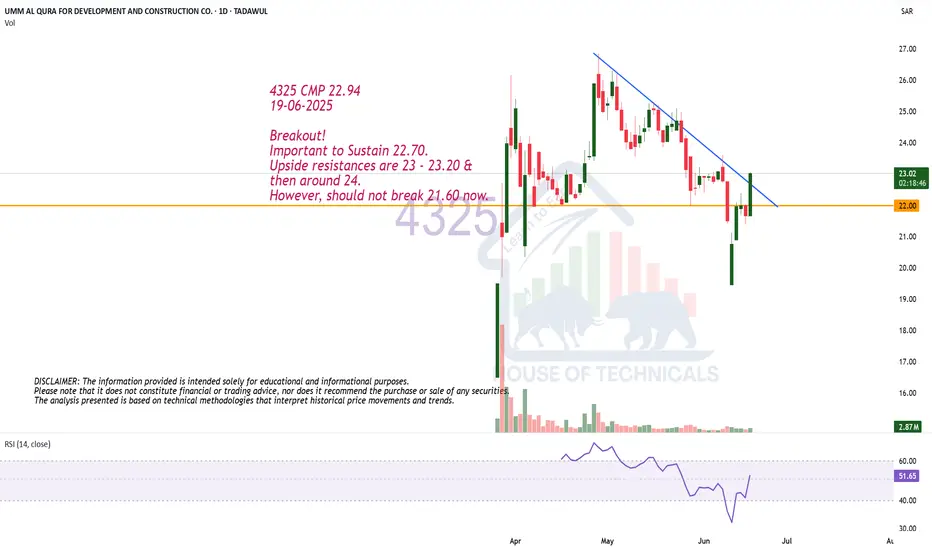
Breakout!4325 CMP 22.94
19-06-2025
Breakout!
Important to Sustain 22.70.
Upside resistances are 23 - 23.20 &
then around 24.
However, should not break 21.60 now.
Bullish Divergence on Weekly TF.2020 Closed at 108.80 (17-06-2025)
Bullish Divergence on Weekly TF.
Double Bullish Divergence on Daily TF.
105 - 108 can be a Good Support leve.
Upside Targets can be around 119 - 120
initially.
It should not break 95 now.

ARAMCO is BullishPrice is in a strong downtrend printing lower lows and lower highs continuously. However, the eight month long trendline seems to be breaking. Moreover, accumulation at current levels is also an indication that bulls are trying to assume control of the price action. If previous lower high is broken with good volume then we can expect a bullish reversal as per Dow theory. Targets are mentioned on the chart.

Falling Wedge Pattern in play.4164 CMP 123.40 (15-06-2025)
Falling Wedge Pattern in play.
Even in worst cases, if 112 is not broken,
we may see upside towards 133, 145 & then
probably around 170+

Stock is in DownTrend but ..4013 CMP 254.20 (15-06-2025)
Stock is in DownTrend but it Beautifully hit Channel
Bottom & Bounced.
Currently at a Good Support level.
Now the Immediate Resistance is around 256 - 257
& then around 270.
Crossing this level & Sustaining on Monthly basis would
lead it towards 283 - 285 initially.
However, should not break 253 - 254.


Though Bearish in Trend, but ..
Closed at 23.38 (03-06-2025)
Though Bearish in Trend, but Strong
Bullish Divergence appearing.
Currently at Important Support level.
Very near Stoploss level; around 23.20
on Closing basis.
If this level is not broken, we may
witness reversal towards 24 & then around
25 - 27.

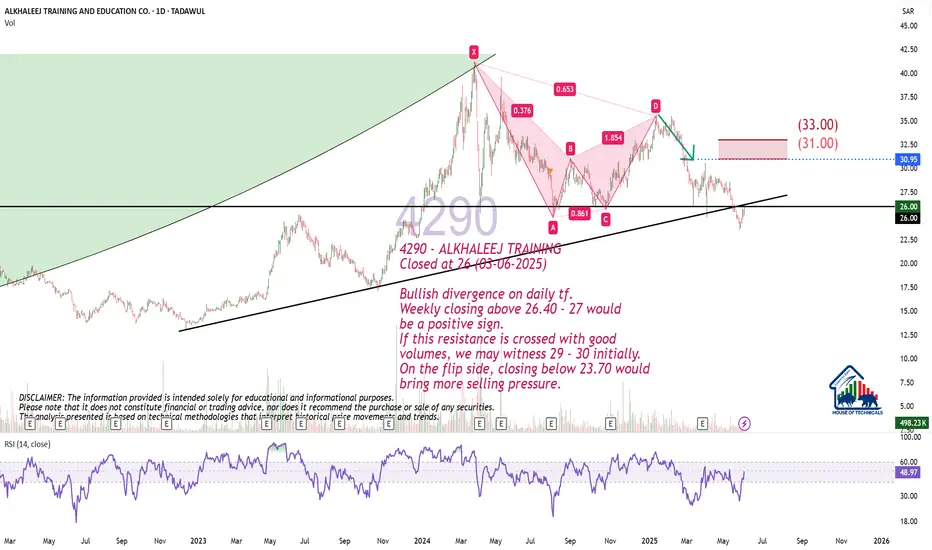
Bullish divergence on daily tf.
Closed at 26 (03-06-2025)
Bullish divergence on daily tf.
Weekly closing above 26.40 - 27 would
be a positive sign.
If this resistance is crossed with good
volumes, we may witness 29 - 30 initially.
On the flip side, closing below 23.70 would
bring more selling pressure.
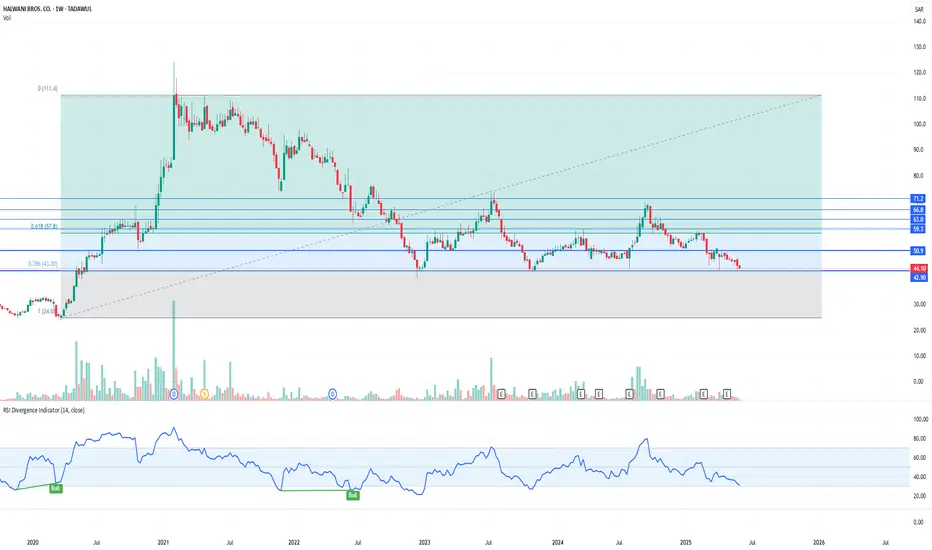
6001:HALWANI BROS. AT IMPORTANT PRICE LEVEL6001: HALWANI BROS is currently at an important price level in the weekly timeframe.
The price range of 43.2-42.9 (fib level of 0.786) has historically been tested 2 times earlier as well. Phenomenal bounce in price can be observed whenever price reached at this level.
Also note that RSI indicator is heading towards oversold range (less than 30) same as recorded on 11th Dec 2022 and 29th Oct 2023.
Hope the price does the same this time around.
Best of Luck!!
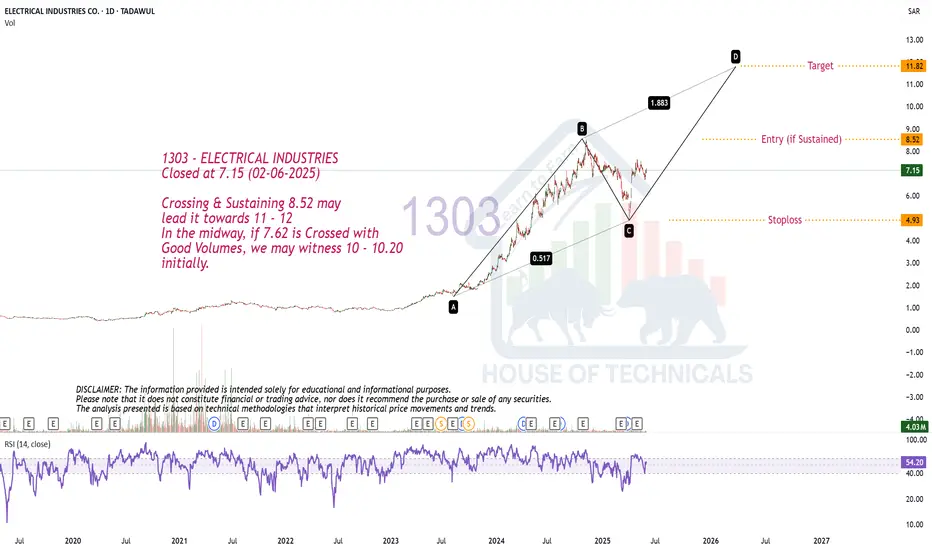
ABCD Pattern
Closed at 7.15 (02-06-2025)
Crossing & Sustaining 8.52 may
lead it towards 11 - 12
In the midway, if 7.62 is Crossed with
Good Volumes, we may witness 10 - 10.20
initially.
Bullish Flag Pattern on Bigger tf + Bullish Divergence
Closed at 60.50 (02-06-2025)
Bullish Flag Pattern on Bigger tf + Bullish Divergence
is there.
54.50 - 62.50 is an Important Support
Zone. If this level is Sustained, we may
witness further upside towards 70-71.
A very Important Resistance Level is around 90-92
which if Crossed with Good Volumes, may expose
new highs.
On the flip side, breaking 51 may bring more selling
pressure.

1150 IS PUSHING LOWERBack in January, I posted to buy 1150, but the market managed to take the opposite direction tp come lower and lower due to the conditions we currently have.
Now the price is pushing towards the level 24.24, we'll see how it will act around the level, but probably it will break through it and reach the next level at 21.92.
So for now don't buy anything on 1150.
Meanwhile, there's a golden opportunity for those who wants to learn how to trade Saudi Market, since it is in a level where you have all the possible configuration you'll face while running low.
Let me know if you got further questions!

2010 WILL GO FURTHER LOWER2 Months ago, I posted that 2010 will go lower but some of you didn'tlisted and contacted me saying that it won't. As usual, time proves who's right and who's wrong.
Now as you can notice on the chart, the price reached the point I told you and went further lower, now we're looking for it to reach 49.60.
DON'T BUY FOR NOW!
Meanwhile, there's a golden opportunity for those who wants to learn how to trade Saudi Market, since it is in a level where you have all the possible configuration you'll face while running low.
Let me know if you got further questions!

A TRADE WE'RE HOLDING We've been holding this trade on 2040 for a month now in which we're doing great so far despite the Market slow movement.
The entry on this trade is based on liquidity and market gaps in case you wondered!
Meanwhile, there's a golden opportunity for those who wants to learn how to trade Saudi Market, since it is in a level where you have all the possible configuration you'll face while running low.
Let me know if you got further questions!

1120 IS GOING TOWARDS 82.6AL Rajhi is one of the stocks most of people buy,
I have read in a group yesterday that it's a golden oppoertunity to buy it now, but if we have a look at the chart, we'll see the opposite, the price just made a reversal as you can see, now it is heading towards 82.6 AT LEAST , don't rush and buy it, instead wait for the oprimal entry to take.
Meanwhile, there's a golden opportunity for those who wants to learn how to trade Saudi Market, since it is in a level where you have all the possible configuration you'll face while running low.
Let me know if you got further questions!
