Still bearish but..Immediate Support seems to be around
25.70 - 26; double bottom but that needs some
confirmation.
If this Support is broken, next support seems
to be around 24 which is also a bearish flag
pattern target.
On the flip side, Resistance area is around 27.80 - 28.50

Stoploss in this case should be below 59.as mentioned in last analysis, 67.70
was an Important Resistance.
Now, 70.70 is Important Level to
Sustain, next targets can be around
84. Buy on Dips can be a Good Strategy.
However, for a Handsome Gain, wait
for 84.20 to sustain; Targets can be
around 125 - 128.
Stoploss in this case should be below 59.

inverted head and two shouldersStock formed a pattern of inverted head and two shoulders and just recently made a breakout

6014an upward trend in the prices of an industry's stocks or the overall rise in broad market indices, characterized by high investor confidence

1833an upward trend in the prices of an industry's stocks or the overall rise in broad market indices, characterized by high investor confidence

2223an upward trend in the prices of an industry's stocks or the overall rise in broad market indices, characterized by high investor confidence


Raydan food Co. 6012It seems to me that the stock is making a false downside breakout. As usual stick to the key points on the chart, that’s what matters MOST !

SAUDI ARAMCO BASE OIL CO. DAILY ANALYSIS After retest consequent encroachment of the wick we will see an expansion to fill gap of down trend

Saudi Cement 3030 : Enough falling!Weekly chart, the stock TADAWUL:3030 has been falling for long time, and is near the long-term support line S (around 39.9).
On the intra-day time-frame, the indicators MACD and RSI are showing the rebound has started.
The price should target the Resistance line R - at around 54 passing through resistance levels at 45 and 49
A safer new buy entry can be above 42 - with the Stop Loss below 40
Closing below the Support line S, the stop loss should be considered.

Saudi cement 3030It will start a new journey to the goals mentioned in the chart. Let’s trust our tools

POTENTIAL SETUP ( TASI : 2010 )As the market currently trading in a Parallel channel. The price was reacting well the support and resistance of channel and a market currently formed a bullish morning star candle on daily TF with a mature bullish divergence. If the market successfully sustain this buying confluence the next leg up could go for new HH.

Saudi N. Bank 1180: To target 41.4 after crossing Resist. line RDaily chart, the stock TADAWUL:1180 is trading in a descending triangle, with upper line R and lower S
It is seen as a short term trading opportunity between S and R.
However, the price should close 2 days above line R to activate the target 41.4 then 43.3
A stop loss should be considered below line R (32.9).
Be careful: Below support line S, the price can fall to next support line S1 at around 31.4

Saudi Dairy 2270 - To target 439 after beating Resistance Daily chart, the stock TADAWUL:2270 is trading between support and resistance lines S and R respectively. Closing above R for 2 days, the price will target 417 then 439
The breakout may happen around 385
Technical indicator MACD signals a minor correction may happen soon.
RSI is indicating a bullish movement.
Below support line S is a stop loss.

2270 Saudi Dairy to target 422 after crossing 330Daily chart, stock is crossing the triangle, and is targeting 422 passing through resistance levels as shown.
RSI and MACS support this view.
Stop loss should be considered at 310

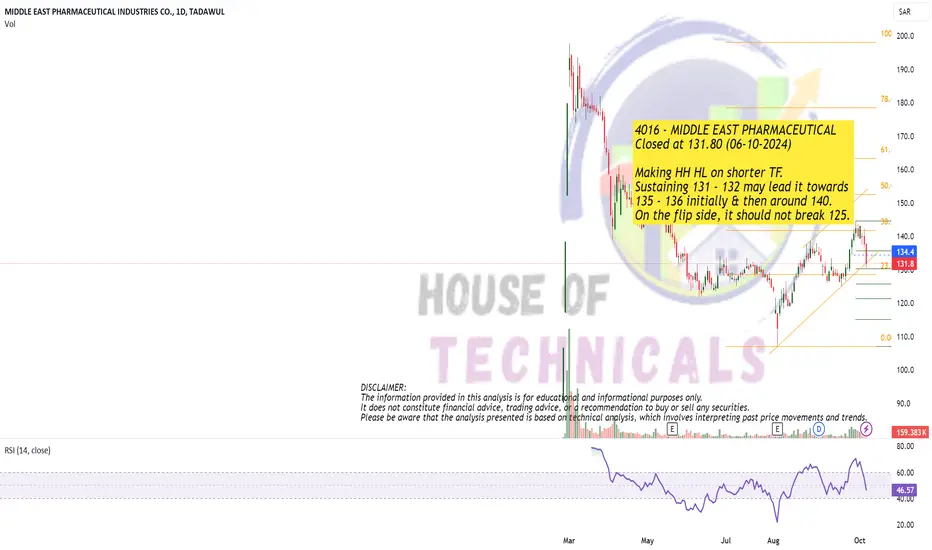
Making HH HL on shorter TF.
Sustaining 131 - 132 may lead it towards
135 - 136 initially & then around 140.
On the flip side, it should not break 125.
4015: Correction (Watchout for reversal_Golden Pocket??)4015
Continuously forming HH and HL
Bullish Flag Pole and C&H target complete
Bearish Divergences are appearing on Daily and Weekly time frames.
Candlesticks on weekly are clearly showing dominance of bears
A correction is expected.
Price currently at Golden Pocket, Watchout for reversal

2281: Watchout for New Entry2281
An important support of 140 is broken, however, it is still in golden pocket (138.6)
Watchout for support at Channel bottom (136.8)
Entry after green candle at support
Do proper risk management

4270an upward trend in the prices of an industry's stocks or the overall rise in broad market indices, characterized by high investor confidence

2020an upward trend in the prices of an industry's stocks or the overall rise in broad market indices, characterized by high investor confidence

1211an upward trend in the prices of an industry's stocks or the overall rise in broad market indices, characterized by high investor confidence

Seera Holding Group - 1810 - KSA - TADAWULThe stock is attempting to form a positive technical pattern, a double bottom. It has confirmed a breakout above the downward trend line, and a positive quarterly close is anticipated. The stock is currently rebounding from a support level within the medium-term upward trend. The targets are set at 25, 27, and 29. The technical analysis aligns with the fair value target of the stock, which is also around the 29 level.

3005an upward trend in the prices of an industry's stocks or the overall rise in broad market indices, characterized by high investor confidence
