2310 IS GOING BEARISHAnother market that people are asking about is 2310.
Don't buy it, and if you have already bought and you're in losses close your positions and wait for the market to give you a proper entry and take it!
Let me know which market you have bought in losses!

WAIT BEFORE YOU BUY 2040As you can notice on the chart, the market still got some gaps to fill before going Bullish.
To buy on 2040 you must wait for the market to fill all the gaps then you can have a safe entry.
Let me know the stocks you're holding in losses.

DON'T WASTE YOUR MONEY ON 2222A month ago I posted not to buy on 2222, but still some people have bought and cashed out all their savings, and some are still in big losses.
The stock is still heading down. DO NOT BUY IT!
Let me know the stocks you have bought for loss!

DON'T BUY 1120Been receiving too many questions about 1120 if it's time to buy it, I can say no since the market gave us a failure swing and now it's heading to the FVG we have to fill it.
Don't buy it and instead invest in the stocks that will come you with profits.
Follow for more!

Review of Nayifat Finance Co's Analysis 4081
Nayifat Finance Co. has demonstrated a robust analytical approach in their recent market assessment. Their focus on key trading concepts, including sell-side liquidity, buy-side liquidity, and market structure shifts, reflects a comprehensive understanding of market dynamics.
Sell-Side Liquidity Analysis: The company effectively identified the 4081 level where sell-side liquidity was taken out. This precise observation is crucial for understanding potential market shifts and making informed trading decisions.
Monthly Target Achievement: Nayifat Finance Co. set a clear monthly target, aligning their strategies with the broader market objectives. Their ability to achieve this target suggests a well-executed plan and accurate market predictions.
Buy-Side Liquidity Focus: The assessment of buy-side liquidity and the creation of Fair Value Gaps (FVGs) demonstrate an in-depth analysis of market trends. This approach helps in identifying potential buying opportunities and market entry points.
Market Structure Shifts: The identification of a market structure shift is a critical component of their analysis. This insight into structural changes within the market is essential for adjusting strategies and capitalizing on new opportunities.
Projection Deviation and Confirmation: The company's projection deviations were well-conceived, with confirmation of targets enhancing the reliability of their predictions. This aspect underscores their ability to adapt and refine strategies based on evolving market conditions.
Overall, Nayifat Finance Co. has provided a thorough and insightful review of market dynamics, showcasing their expertise in forex trading and technical analysis. Their methodical approach to liquidity analysis and market structure shifts positions them as a strong player in the financial sector.

Al Yamamah Steel Industries - ksa - Long-term We expect the stock to enter an accumulation phase at its current levels, followed by movement towards the targets outlined below. This is supported by improved business results, increased production capacity, and a boost to the construction sector due to interest rate cuts. Although several financial factors are currently affecting the stock, we foresee the possibility of improved financial performance and recovery by the first half of 2025.

Beautiful Bullish Engulfing Candle on Weekly Basis.Beautiful Bullish Engulfing Candle on Weekly Basis.
55.50 is an Important level that should be sustained
on Monthly basis.
However, 59.30 - 62 is the Resistance range.
52 should be the Stoploss for now.

Amlak 1182 - Bullish Signs
It was great week with this stock in low time frame and now show strong signs in daily:
1- Break VWAP
2- Break level 10.8
3- Bullish candle
Price Target
TP1: 11.88
TP2: 200 MA

BANQUE SAUDI FRANSI 1050 - Bullish Signs
1- Bounce from demand level at 33.5
2- Break VWAP
3- Bullish candles
Price Target
TP1: red box (GAP)
TP2: red line Monthly Open (37.25)

AYYAN Investment - TADAWUL: 2140 - KSAThe stock is currently trading near the resistance level of SAR 17.40. If this level is breached, the stock is expected to target prices of SAR 18.50, followed by SAR 21. The stock has become suitable for trading after recent transactions in the last financial period, due to the anticipated financial adjustments that will be reflected in the company's upcoming Q3 financial statements.


* Morning Star Formation on Daily TF.
* Bullish Divergence on Hourly TF.
* Huge Volume witnessed in Last Trading Day.
* Can be a Good Buy with a Stoploss below
29.20 on Closing Basis.

Play wiselyImmediate Support seems to be around 284 - 286.
Important Resistance seems to be around 297 - 299.
Breaking 275 would make it Bearish.

2110Saudi Cable's current trading position below the 200-day Exponential Moving Average (EMA) suggests a bearish trend. A potential shift to a bullish outlook could occur upon maintaining levels above the 200-day EMA. There are indications of an Adam & Eve formation forming in its price action, with the neckline of this pattern situated around 81. Price action has shown rejection from this level after forming the Adam, with a potential formation of the Eve anticipated. Completion of the Eve could lead to a bullish sentiment following a breakout.
A support zone is identified approximately between 56-57, from which a rebound is anticipated. Two plausible scenarios could invalidate this analysis: firstly, if the price fails to decline further and breaks out above 81, maintaining levels above, thereby shifting sentiment from bearish to bullish. Secondly, if the price drops below the support level of 56, a more bearish price movement could be expected.
It's important to note that these observations are speculative and not financial advice. It's recommended to conduct thorough research before making any trading decisions, whether long or short positions.

4163 • TADAWUL - Al-Dawaa Medical ServicesThe stock presents an investment opportunity. The optimal buying zones are around the 90-88 level, targeting the areas mentioned on the chart. Growth opportunities in the sector across various regions in the Kingdom remain promising.

Bullish on All Time Frames.
74.50 was a Very Important Resistance
that it has Crossed; & it may act as Support Now.
Now that if this level is Sustained on Monthly
Basis, we may witness 89 & then 93.

4011an upward trend in the prices of an industry's stocks or the overall rise in broad market indices, characterized by high investor confidence

2180an upward trend in the prices of an industry's stocks or the overall rise in broad market indices, characterized by high investor confidence

2050an upward trend in the prices of an industry's stocks or the overall rise in broad market indices, characterized by high investor confidence

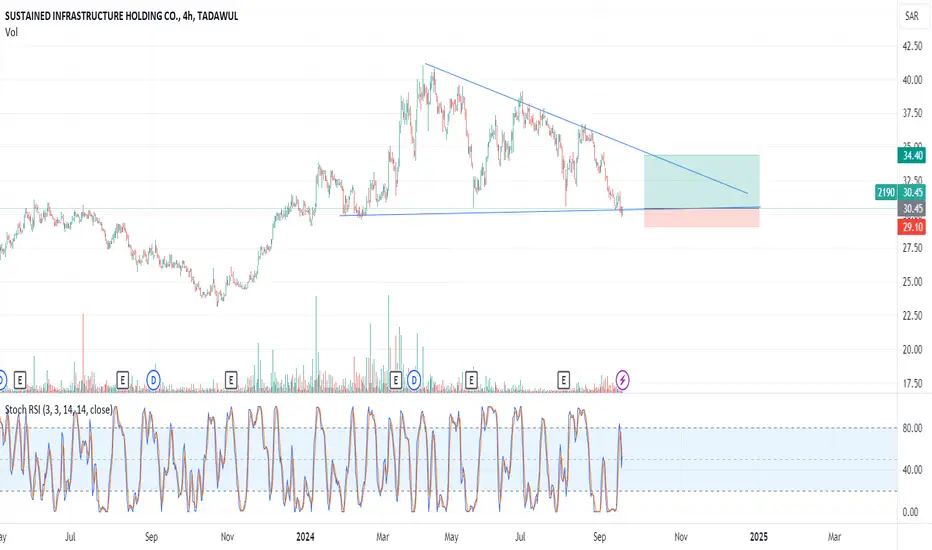
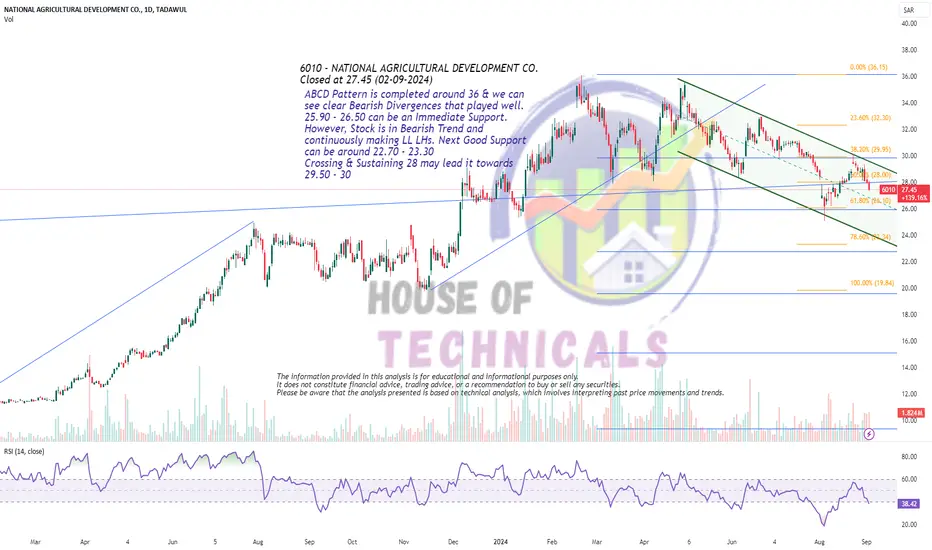
ABCD Pattern is completed around 36ABCD Pattern is completed around 36 & we can
see clear Bearish Divergences that played well.
25.90 - 26.50 can be an Immediate Support.
However, Stock is in Bearish Trend and
continuously making LL LHs. Next Good Support
can be around 22.70 - 23.30
Crossing & Sustaining 28 may lead it towards
29.50 - 30
Saudi Marketing Company (Frm Suprs) - 4006"The stock has formed a positive double-bottom pattern and is moving towards its target. Additionally, we see the potential to reach the peak in the medium term, making the current levels a buying opportunity to move towards the indicated targets on the chart."
