
DON'T BUY 4003As you can notice on the chart we have a high volume bearish move, which means the market will break the current level and reach the next one where we can see how the xstock will act.
The comment section is all yours for further questions!

DON'T BUY 2222I got lots of questions from people who have bought 222 and they're in losses now about if the stock will riase or no.
My answer is always NO, the price is falling down and it will keep falling to the LEVEL 26.60 where we can see what will be the next move of the price.


**Bank Saudi Fransi (BSF) 1050 - Market Update and Analysis****Bank Saudi Fransi (BSF) - Market Update and Analysis**
**Overview:**
Bank Saudi Fransi (BSF) has recently undergone a significant shift in market dynamics, capturing the attention of traders and investors alike. The bank has executed a strategic move involving sell-side liquidity grab, a change in status delivery, and the formation of a Fair Value Gap (FVG), signaling a potential buying opportunity. Here's an in-depth review of these developments and their implications.
**Sell-Side Liquidity Grab:**
In a bold move, BSF targeted sell-side liquidity, which refers to the capturing of liquidity resting below support levels where stop-loss orders are typically placed. This maneuver is often used by institutional players to trigger these stops, creating a temporary dip in prices before reversing. This liquidity grab can be seen as a strategic step to shake out weak hands and gather momentum for a more substantial move upwards.
**Change in Status Delivery:**
BSF's change in status delivery marks a pivotal point in its market behavior. This shift can indicate a transformation in the bank's trading stance or strategy, reflecting a broader market sentiment or internal revaluation. Such changes often precede significant price movements and can be an early signal for astute traders to anticipate and align their positions accordingly.
**Formation of Fair Value Gap (FVG):**
The creation of a Fair Value Gap (FVG) is particularly noteworthy. An FVG occurs when there is a price inefficiency in the market, typically seen as a gap between the closing price of one candlestick and the opening price of the next. This gap signifies an imbalance between buyers and sellers, often leading to a price correction to fill the gap. In BSF's case, the FVG indicates a potential buying zone, suggesting that prices may rise to fill the gap left by the liquidity grab.
**Buy-Side Liquidity Target:**
Following the liquidity grab and the formation of the FVG, BSF is poised to attract buy-side liquidity. Buy-side liquidity refers to the areas above current prices where buy orders are clustered, such as previous resistance levels or key psychological price points. The strategic targeting of these areas suggests a bullish outlook, with the potential for prices to climb as buying pressure mounts.
**Conclusion:**
Bank Saudi Fransi's recent market activities highlight a sophisticated approach to liquidity management and market positioning. The sell-side liquidity grab, coupled with the change in status delivery and the formation of a Fair Value Gap, presents a compelling narrative for potential price appreciation. Investors and traders should closely monitor BSF for buying opportunities, especially as the market seeks to target buy-side liquidity, potentially leading to significant upside momentum.
**Disclaimer:**
This review is for informational purposes only and does not constitute financial advice. Traders and investors should conduct their own research and consider their risk tolerance before making any investment decisions.
---
Let me know if you need any adjustments or additional information!

Making HH HL on Daily TF.
Bullish on All Time Frames.
However, Slight Bearish Divergence on Hourly TF;
which may bring the price towards 144.50 -145.50
& then around 136 - 137.
Important Resistance around 158 -159.
Sustaining 159 with Good Volumes will expose
New Highs, may be around 180s.
Note that Initial Resistance is around 153
that needs to be Sustained to neglect the
Bearish Divergence.

Play on LevelsPlan1
Buy Above 34 (if Sustained)
Sell around 39 - 41
Stoploss 33 (closing basis)
Plan2
Buy1 around 29.30 - 30.50
Buy2 around 27.30 - 28.50
TP1 around 33 - 33.50
TP2 around 35 - 36
Stoploss 26.80 (Closing basis)

1322The price action is in an uptrend making higher highs and higher lows with the negative session observed in the last trading session and price closes at 58.70 (-1.51%). Support level lies in the range of 57.50-58 where long position can be consider with the stop loss below 55 to manage risk. On the flip side, initial resistance lies in the range of 61-61.50 and secondary resistance range around 65-65.50.
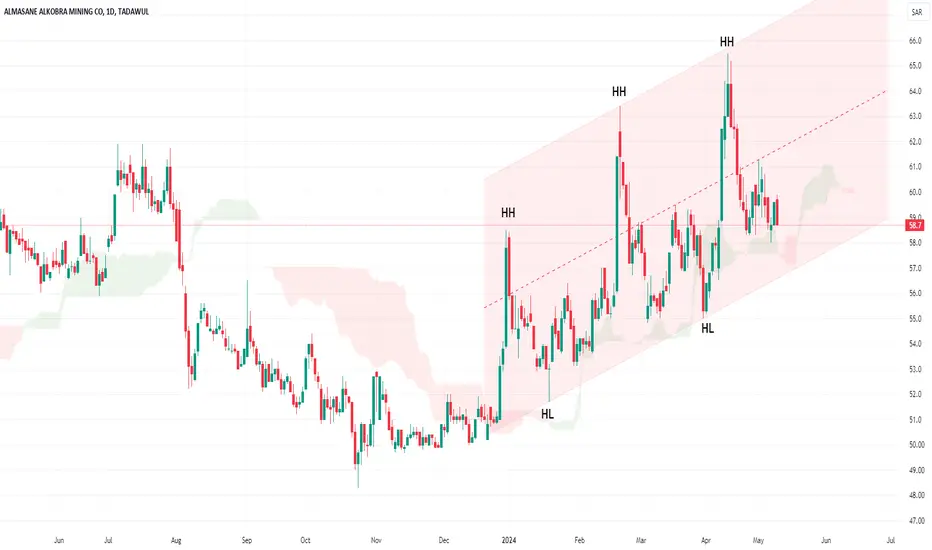
Buy SideBuy1 around 62 - 62.70
Buy2 around 58 - 59
Average Buying Rate would be: 60.43
TP1 around 65 - 66
TP2 around 67
Stoploss 57 (closing basis)

MBC long This is best apparently to get up with MBC group
There is a sine of reflection has been begun 44.40
The TP is 55
Stop losing under 42.90

Play on LevelsPlan1
Buy Above 46 (if Sustained)
Sell around 50 - 51
Plan2
Buy1 around 43 - 43.50
Buy2 around 39.70 - 41.30
Sell around 45 - 45.50
Stoploss 38.50 (closing basis)

2001 Methanol Chemicals: Monthly Bullish Order Block ReactionGreetings, traders! 🌟 I’ve identified a compelling setup in the 2001 Methanol Chemicals market on the monthly chart. Join me as we explore the potential for a lucrative trade opportunity.
Analysis:
Bullish Order Block Identification: On the monthly timeframe, a clear bullish order block is developing in the 2001 Methanol Chemicals market. This zone typically signifies sustained buying interest and potential for upward movement.
Key Price Tab Reaction: Recently, there’s been a significant reaction at a specific price tab within this bullish order block. This reaction underscores the importance of this level, potentially serving as a strong support or resistance point.
Technical Confirmation: Technical indicators, including moving averages and RSI, are aligning with the bullish bias, suggesting favorable conditions for a potential uptrend continuation.
Trade Strategy:
Entry Point: Consider initiating long positions on a confirmed breakout above the recent reaction level, signaling renewed bullish momentum.
Stop-loss Placement: Implement a stop-loss below the lowest point of the bullish order block to manage risk effectively and protect capital.
Profit Targets: Target potential upside based on Fibonacci extensions or significant historical resistance levels. Refer to the attached chart for precise target levels.
Risk Management:
Risk-Reward Ratio: Maintain a balanced risk-reward ratio to ensure that potential gains justify the risks taken in the trade.
Position Sizing: Adjust position sizes based on your risk tolerance and account size, adhering to sound risk management principles.
Conclusion:
This setup in 2001 Methanol Chemicals presents a promising opportunity based on the bullish order block and recent price tab reaction. As always, exercise caution and follow your trading plan diligently.
Chart Targets: Refer to the attached chart for specific profit targets marked with Fibonacci levels and historical resistance points.
Disclaimer: This is not financial advice. Please conduct your own research or consult a financial advisor before making any investment decisions.

Buy SideBullish Divergence at a Support Level
around 86 - 88 is a Positive Sign.
Immediate Targets can be around 92 then 99

2223Great opportunity again to take a position in the company, targets are the red lines and the stoploss is 128.
Dr SAUD

4220 Emmar 12% profit 4220 Emmar 12% profit with low cost.
The company has a huge projects that are working on and 6.5 is undervalued.
It has a gap to be filled with 12% profit from 6.5 and stop line is under 6.3

Buy CallBuy1 @ CMP or around 92
Buy2 around 88 - 89
Sell around 99 - 100
Stoploss 87 (closing basis)

3007 Zahrat Al Waha long As we see Zahrat Alwaha is ready to achieve the first TP1 at 44.70
The stop is 39.40

Weekly RSI MACD Fibonacci//@version=5
indicator("Weekly RSI MACD Fibonacci", overlay=true)
// Get the weekly data
symbol = syminfo.tickerid
weekly_close = request.security(symbol, "W", close)
// RSI Calculation
rsi_length = input.int(14, title="RSI Length")
rsi_overbought = input.int(70, title="RSI Overbought Level")
rsi_oversold = input.int(30, title="RSI Oversold Level")
rsi = ta.rsi(weekly_close, rsi_length)
// MACD Calculation
macd_length_short = input.int(12, title="MACD Short Length")
macd_length_long = input.int(26, title="MACD Long Length")
macd_signal_smoothing = input.int(9, title="MACD Signal Smoothing")
= ta.macd(weekly_close, macd_length_short, macd_length_long, macd_signal_smoothing)
macd_histogram = macd_line - signal_line
// Fibonacci Levels
var float fib_high = na
var float fib_low = na
var float fib_0 = na
var float fib_0_382 = na
var float fib_0_5 = na
var float fib_0_618 = na
var float fib_1 = na
if (na(fib_high) or weekly_close > fib_high)
fib_high := weekly_close
if (na(fib_low) or weekly_close < fib_low)
fib_low := weekly_close
fib_0 := fib_low
fib_1 := fib_high
fib_0_382 := fib_0 + (fib_1 - fib_0) * 0.382
fib_0_5 := fib_0 + (fib_1 - fib_0) * 0.5
fib_0_618 := fib_0 + (fib_1 - fib_0) * 0.618
// Plot RSI
hline(rsi_overbought, "RSI Overbought", color=color.red)
hline(rsi_oversold, "RSI Oversold", color=color.green)
plot(rsi, "RSI", color=color.blue)
// Plot MACD
hline(0, "Zero Line", color=color.gray)
plot(macd_line, "MACD Line", color=color.red)
plot(signal_line, "Signal Line", color=color.blue)
plot(macd_histogram, "Histogram", color=color.green, style=plot.style_histogram)
// Plot Fibonacci Levels
plot(fib_0, "Fib 0%", color=color.red, linewidth=2)
plot(fib_0_382, "Fib 38.2%", color=color.orange, linewidth=2)
plot(fib_0_5, "Fib 50%", color=color.yellow, linewidth=2)
plot(fib_0_618, "Fib 61.8%", color=color.green, linewidth=2)
plot(fib_1, "Fib 100%", color=color.blue, linewidth=2)

TANMIAH: Trendline Support_BullishTanmiah is respecting a trendline support
A recent resistance (horizontal line) is broken and converted into support. A retest at new support line is observed.
Aggressive and conservative entry levels with SL are specified with TPs.
Manage your risk accordingly.


Savola group 2050 - Bullish Signs
Show some strong signs:
1- Break 200 ma
2- Break Daily 200 ma
3- Break VWAP
Price Target
TP1: 48.3
TP2: 50.4
