Beautiful Monthly Closing.
Closed at 122 (29-05-2025)
Beautiful Monthly Closing.
However, 125 - 126 is an Important
Resistance that needs to Sustain for
further upside.
Entry can be taken with a Stoploss below
117; targeting 125 - 126 initially.

8180Hello traders,
I think it is read to move with the end of spring.
with stop loss 3% and main target of 44%.
move SL every 10% or close it partially.
Good Luck

2170Hello traders, with the strong downtrend of the TASI , you noticed the strength of this stock.
It looks like there is something fishy will occurred.
I hope it will go fast as planning in the chart.
Good Luck

Double Bottom + Bullish Divergence.2280 - Closed at 51.80 (26-05-2025)
Double Bottom + Bullish Divergence.
Channel Bottom & respecting Trendline so far.
Crossing 53.20 with Good Volumes may
result in reaching 55 - 56.
50.30 should be the SL.

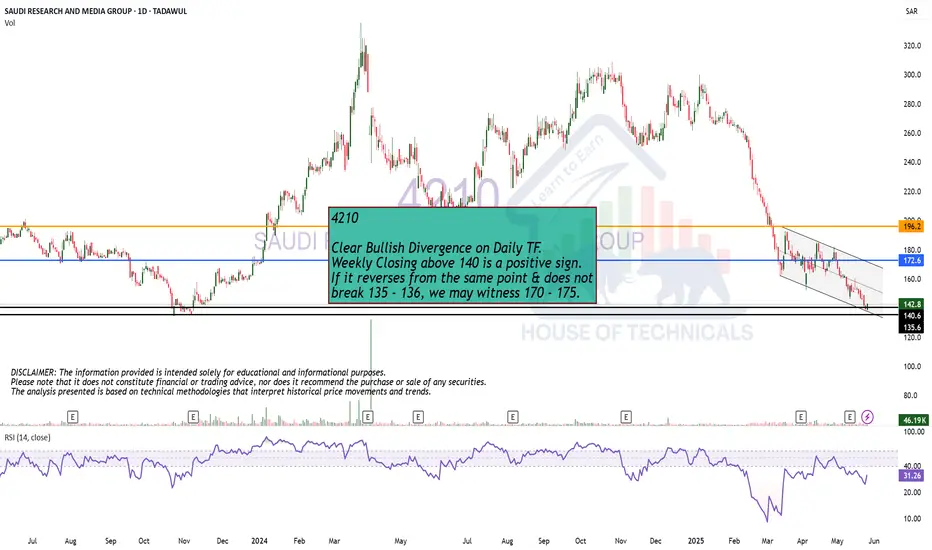
Clear Bullish Divergence on Daily TF.
Clear Bullish Divergence on Daily TF.
Weekly Closing above 140 is a positive sign.
If it reverses from the same point & does not
break 135 - 136, we may witness 170 - 175.
Flag & Pole Pattern observed for 1303 on Weekly TFFlag & Pole pattern observed for EIC 1303 in tadawul. If price breaks this channel 7.31 & sustains above 7.47 then it could go up to 8.07, 8.65 & 9.12. SL of 7.09 can be placed for good investment returns.


DON'T BUY 43004300 is going in a bearish movement after that it gave us a new high, for now it's not the right time to buy it, and if you just bought or holding shares any place nearby the high, you can close and wait for the next bullish rally.
Follow for more!

Inverse H&SBeautiful Inverse H&S pattern in place.
Sustaining 42 may lead it towards 48 & then 50 - 54.
39 - 40 can be an immediate Support.
However, breaking 36 may bring more Selling pressure.

1210 scenario on the daily timeframeI expecting this is good opportunity, suppose price will be breakout this resistant line.

1834 Cup And Handle patternCup And Handle pattern observed with a short -term target of at least +10%

Inverted H&S Pattern in place.
Inverted H&S Pattern in place.
Breakout done.
May take a Risk with a SL of 81 on Closing basis.
Targets can be around 92 - 95 then 100-102

Something happened I have no idea why this is happening, but we are going deep down.
If we’re lucky, we might see 65 SAR.
the target is 52 SAR, and it could keep going lower.

Bullish
Bullish Divergence on Daily tf.
Immediate resistance is around 83 - 83.50
Very important to cross & sustain 86 - 87
for further upside.
However, should not breakk 65.50 , otherwise
we may witness further selling pressure.

Bullish divergence in OthaimBullish divergence is observed in the daily timeframe for Othaim. The current downtrend is expected to reverse after the bullish divergence. The current downtrend is likely to reverse into an uptrend and reach levels indicated on the chart. When the trend starts to reverse and breaks the entry point level indicated on the chart, it will be considered a confirmation of the trend reverse and a good point to take a long position.

Bullish divergence in Saudi AramcoBullish divergence is observed in the daily timeframe for Saudi Aramco. The current downtrend is expected to reverse after the bullish divergence. The current downtrend is likely to reverse into an uptrend and reach levels indicated on the chart. The trend has already started to reverse and the previous LH is broken, confirming the trend reversal and a good point to take a long position.

Bullish Divergence!
Good to Buy on dips with SL 97
TP1 around 100 - 101
TP2 around 102 - 102.50
Crossing & Sustaining 106 may
lead it towards 113 - 115.

Extremely Bullish.
Extremely Bullish.
Took Support from a very Important level around 136 - 140.
Hidden Bullish Divergence has appeared.
176 - 182 is a Resistance Zone.
Crossing & Sustaining 201, lead it towards 235 - 237.
On the flip side, 170 & 161 - 162 seems to be a Good Support level.

Formed Strong Double bottom around 40.Formed Strong Double bottom around 40.
Immediate Resistance is around 46 - 47
Crossing this level & sustaining with good volumes
may witness 48.50 - 49.
On the flip side, 44 - 44.50 seems to be a Good Support.

H&S pattern Breakout.
H&S pattern Breakout.
67 - 68 can be an important Support.
71.50 - 72 is the initial Monthly Resistance.
Crossing & Sustaining this level may
take the price towards 82 - 85.
However, breaking 61 may result in
further selling pressure.

1322 GOING TOWARDS THE TARGETOne of the latest trades I shared with my clients is going towards the target, you still can buy but it won't be as safe as if you bought at the entry I gave them.
Follow for more!
For further questions, don't hesitate to ask!


1182 IS PREPARING AN ENTRYA month ago, I posted that 1182 is going lower to reach 11.36 for a liquidity crab, now after that it did, we can prepare ourselves to take the entry it is preparing so we can recover from the loss we've been through in the market crash.
Follow for more updates!
