Saudi Telecom Company (STC): A Promising Investment OpportunitySaudi Telecom Company (STC), a dominant player in the telecommunications sector, has experienced a recent correction in its stock price from a high of SAR 43 to the current level of around SAR 35. Market analysts identify an interesting entry level for STC between SAR 32 and SAR 34, offering potential investors a compelling opportunity to capitalize on the company’s robust market position and future growth prospects.
Additionally, STC offers an attractive dividend yield of approximately 7.08%, making it an appealing choice for income-focused investors. With its extensive infrastructure and commitment to innovation, STC remains well-positioned to benefit from the growing demand for digital services in Saudi Arabia and the broader region. Investors should consider this correction as a strategic entry point to gain exposure to a leading telecommunications provider poised for continued expansion and profitability

Jabal Omar Development Company: New Opportunities AheadJabal Omar Development Company, a leading real estate firm in Saudi Arabia, recently received approval to accommodate pilgrims, marking a significant milestone for the company. This approval is expected to boost the company's operations, particularly in the hospitality sector, catering to the influx of religious visitors.
The company's stock has seen a correction from SAR 30 and is currently anticipated to stabilize around SAR 22.5 to 21, presenting a promising new entry level for investors. This correction provides a strategic investment opportunity as the company leverages its new approval to drive growth and enhance shareholder value.
Investors should keep a close eye on Jabal Omar as it continues to capitalize on its prime location and regulatory advancements, potentially leading to substantial returns in the near future.
DR SAUD

SAUDI RESEARCH & MEDIA GROUP (4210)🚀 Stock Alert: SAUDI RESEARCH & MEDIA GROUP (4210)
📈 Investment View: Technically Bullish 📈
🔍 Quick Info 🔍
📈 Entry Range: 220
🎯 Targets : 270
⚠ Stop Loss: 200
⏳ Nature of Trade: Long Term (Swing)
📉 Risk & Reward Ratio: 1 : 2.50
📰 Technical View: In the preceding trading week, the price movement successfully breached the significant resistance level of 220 SAR, culminating in a notable total gain of 30.2 SAR (+14.60%) and concluding at 237 SAR. Additionally, the super trend indicator has signaled a bullish momentum within the weekly time frame, further corroborated by the confirmation provided by the MACD indicator. Looking ahead, the former peak at 270 SAR now functions as a resistance barrier, potentially prompting profit-taking activities. Conversely, there exists a possibility for the price to retest the 220 SAR level, transforming it into a support level, having previously served as resistance. To mitigate risks, a prudent approach involves placing a stop loss below the breach point of 200 SAR, as a reversal in momentum may occur subsequent to this breach.

4164Pull back from 0.5 (137 SAR) Fibonacci level is observed. Currently price is trading around 141.80 SAR. Resistance level lies around 151 from where selling can be expected. If is breaks and sustains then more upward can be expected. Use stop loss to manage risk below the support level of 137 SAR.

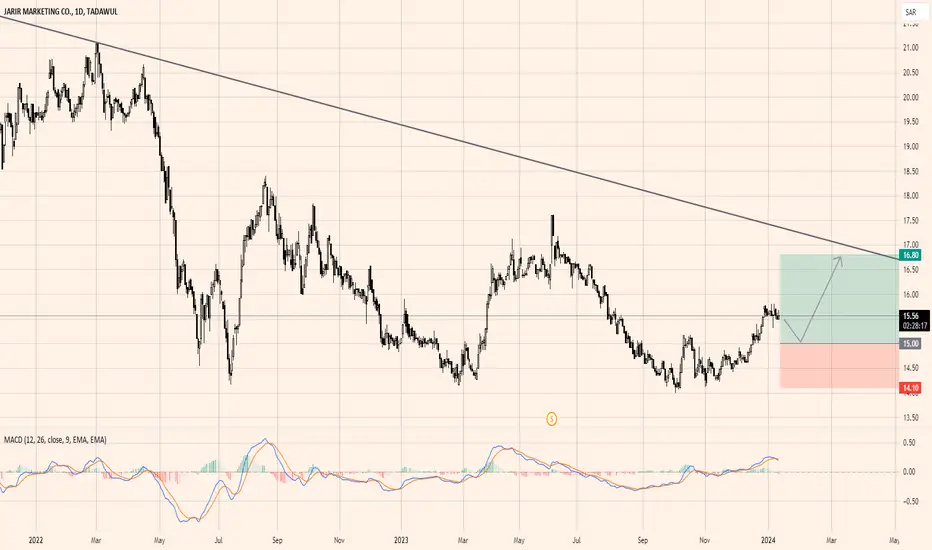
4190Jarir Marketing Company (4190) shows rejecting after cross over seemed in MACD. Support level is at 15 from where pull back can be seen. In a longer term price can test descending trend line around 16.80. To manage risk, a recommended stop-loss can be placed below 14.10.

7203The price is currently testing 200 day EMA with the closing price of 842.4 in the last trading session. Moving forward, if this level sustains then a possible pull back can be seen in its price with the initial resistance lies around 954 and secondary resistance level lies around 1,003. Use stop loss at 815 just below the recent low.

4071The price action is currently near the test of ascending trend line after got rejection from 298.4 level where bearish divergence with RSI is observed and closes at 221.4 in the last trading session. Upon sustaining the trend line support price can pull back towards its resistance levels of 240. If it breaks down ward then further bearish momentum can be seen.

2281: At Support Level or Cup & Handle (Watchout)2281 is forming a cup and handle pattern on daily timeframe.
Volumes are low
However, Price is at a significant support line confluence with volume POC
A trendline support is respected in the past.
If the support confluence is respected, price will go up and touch the TP levels of 123
However, if it breaks down then there is a long bearish rally.
Watch out to take positions.

DON'T BUY 2222Here as you can see on 2222, the price is still heading down and for now there's no indication that it will come back up, don't buy it and if you're holding in loss just sell and invest in stocks on which you will make profits.
For further questions, don't hesitate to ask!

7010 IS STILL GOING DOWNLast week I posted not to buy 7010 since it is continuing its way down to fill the gaps we have in the market.
Now as you can see the market is approaching to the level it will pullback on, and that doesn't mean that it's time to buy since we must wait for some conditions to be met before we decide if we buy or no.
For more questions, don't hesitate to ask!

YOU STILL CAN'T BUY 1120Dear Saudi traders,
Last week I posted that you can't buy 1120 since it still going down, and here it is.
For now there's no point of buyin 1120, instead, you can check the other markets where you have the opportunity to buy.
For further questions don't hesitate to ask!

Levels playing wellBullish on Weekly as well as Monthly TF
Crossing 179 will lead it towards 200+ then 250
149 is a Very Strong Support that should be Sustained
on Monthly Basis
However, 155 then 140 - 141 may act as Weekly Supports

Important levelImportant Point as shared on 21-04-2024
is Still Valid.
however, breaking 4.60 will expose 4 - 4.10

4200: High probability of an uptrendWe have a high probability of having an upward trend as you can see on the graph if and only if all the analysis conditions are met.Thanks!

2060 Al Tasni Company Summary
2060 Al Tasni Company, currently priced at SAR 11.40, operates in the petrochemical manufacturing sector. The stock is forming a price range between SAR 11.10 and SAR 11.60, presenting a potential entry point for investors.
With a 52-week range of SAR 10.40 to SAR 15.50, the company has shown volatility influenced by market trends.
It maintains a robust balance sheet with healthy cash reserves and manageable debt. Recent financial results indicate consistent revenue and profitability.
Analysts rate the stock as a "Buy," with a 12-month price target of SAR 14.00 to 17.
A Key growth drivers include expansion plans, new product lines, and strategic partnerships. Investors should monitor global oil prices and regulatory changes in Saudi Arabia, while considering a stop loss at SAR 10 to manage risk.

4200:Buy ideaBuy idea on 4200 as you see on the chart after the breakout with force the vwap and the resistance line by a big green candle follow by a large green volume. Thanks!

A technical look at the stock chart for STC Saudi ArabiaTechnical analysis indicates that STC stock may decline soon
This decline confirms the formation of a negative technical pattern on the monthly and weekly frames, and it is expected to visit the area marked in white to complete the objectives of the descending wave. TADAWUL:7010

4012: ALASEEL Long PositionALASEEL created a HH,HL formation
Entry is triggered at 5.19 as morning star candlestick pattern is formed at HL and trend line is respected
Long Position can be taken with:
SL = 4.99 ; TP = 5.78
Risk/Reward = 1:3
Good Luck!!

Alahli Bank to all time high as you see in the chart everything is clear
i hoop to activate the SL NO jokes with STOP LOSE
we will change the SL soon when we get some confirmation in the chart.
GOOD LUCK & TRADE SAFELY

2381Arabian Drilling Company is in a down trend since 18th March' 2024. Currently it is testing its demand zone around 136 and RSI indicator is at over bought level and the doji candle formation is observed which indicates a bullish reversal from this level. Use stop loss below demand zone at 130. Initial resistance lies around 148 upon break and sustain secondary resistance lies around 156.

7200: MIS Long PositionMIS created a HH,HL formation
Entry is triggered at 164.8 as bullish candle is formed at HL
Long Position can be taken with
SL = 158.4 ; TP = 178 (ATH)
Risk/Reward: 1:2
Good Luck!!

Though Still in Downtrend but Though Still in Downtrend but
Bullish Divergence on Daily TF.
Seems like taking Support from 17.14
which is 78.60% fib. retracement level.
Entry can be taken at CMP with a Stoploss of 17
(on closing basis) targeting 18.50 - 19 initially
which is again 61.8% fib level.
