Saudi arabian oil monthly chartit is better to wait for the price to go to the outlined target for a good opportunity to buy

Arabian Drilling - Time to buyaccording the the doubled channel, we are at the bottom and it is expected to reflect until 160

#ALMARAI_#BEARISH TRENDLooks like Bearish trend will continue for a little while based on the current chart pattern. Possible entry point can be seen in the chart highlighted in Blue and with red.
#DYOR (Do your own Research)

Buying AramcoBuy Aramco as described in the analysis provided and follow the steps specified in Stop Loss and Take Profit

4031: Rebound from SupportPrice has touched support level and started taking a ride until specified resistance level
price moving in a range bound
Support and resistance levels are specified for short term trade
Enter more after breakout

2281: Tanmiah (Rebound after correction)Financial results show disappointment for the traders in Tanmiah
Cost has taken a correction (78.6% fib levels)
Price appear to be taken support from Volume Profile (POC)
Trade with specified SL (or even tighter SL)
TP levels are identified.

LL on Daily TFTo Continue the Bullish Trend,
it should cross & sustained 36.10; the target
would then be around 44 - 45.
Recently, it made a LL on Daily TF.
Now 32.60 - 33 should be Sustained, otherwise
the price will move further down towards
29.80


1010: Big probability of an uptrendWe would have a high probability of having an uptrend if and only if the vwap indicator as well as the resistance line are broken forcefully.Thanks!

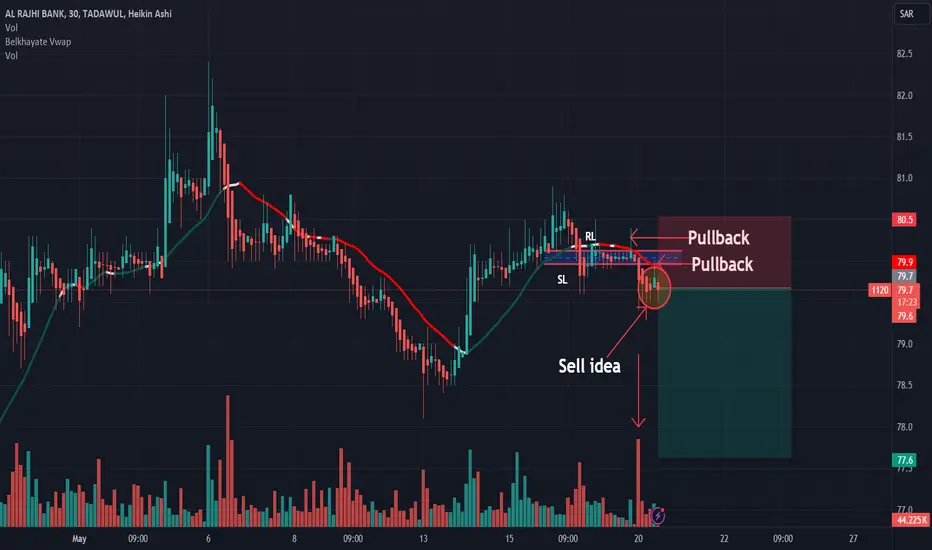
1120: Sell ideaSell idea on 1120 as you see on the chart because we have two pullback on vwap and also we have the breakout of the support line.Thanks!
2222: Buy ideaOn 2222 as you see on the chart we could have a big probability to have an uptrend if only if we have the breakout with force the vwap and the resistance line by a big green candle follow by a large green volume! Thanks!

Golden PocketCurrently, it is in Golden Pocket and if it takes Support
from this level, we may expect Good Gains.
It should Not Break 85 on Monthly Basis (monthly support level).
Breaking this level will expose 63 & then 55 in bit longer term.
However there is a Bullish Divergence on Daily TF
& we may expect reversal from around 86 -87.
Initial hurdles can be 92 - 93 & if 97 is Crosses &
Sustained, we may witness trend reversal targeting
100 then 108.

Bullish Divergence on Hourly, Daily as well as Weekly TF.Bullish Divergence on Hourly, Daily as
well as Weekly TF.
Entry can be taken around 31 - 31.70 with
a Stoploss of 29 on Closing basis.
Immediate Targets can be 34 - 35
However, it would be More Bullish & will
be in Uptrend once it croses 35 - 36

114.50 - 115.50 is an Important Resistance114.50 - 115.50 is an Important
Resistance that should be Sustained
for Upside Move.
On the flip side, Good Support levels
are 108 - 110 and then 96 - 98.
However, Risky Players may take at Risk at
CMP (109.80 - 110 should be Sustained on
Weekly basis).
Stoploss in this case should be around 95
(on closing basis)

30.80 - 31.80 is an Important Support30.80 - 31.80 is an Important Support
that should be respected for Upside Move.
Next Support is around 28.60 - 28.80
Immediate resistance lies around 33.50 - 34
and if 39 is Sustained, we may wintess 45

Breaking 116 - 117 will expose 95 - 96Bullish Divergence on Daily TF.
125 is an Important level that
should be sustained on Weekly basis.
From 126 to 130 - 133 can be a
Swing Trade Setup with a Stoploss of 125.

Nahdi### Key Points of a Falling Wedge
1. **Bullish Reversal Pattern**: Indicates a potential reversal from a downtrend to an uptrend.
2. **Converging Trend Lines**: Two downward-sloping lines that converge, connecting lower highs and lower lows.
3. **Volume Decreases**: Typically declines during the formation of the wedge, showing weakening bearish momentum.
4. **Breakout Confirmation**: A valid breakout occurs when the price moves above the upper trend line, ideally with increased volume.
5. **Trade Strategy**: Enter at the breakout, place a stop-loss below the lowest point of the wedge, and set a target price by adding the wedge's height to the breakout point.

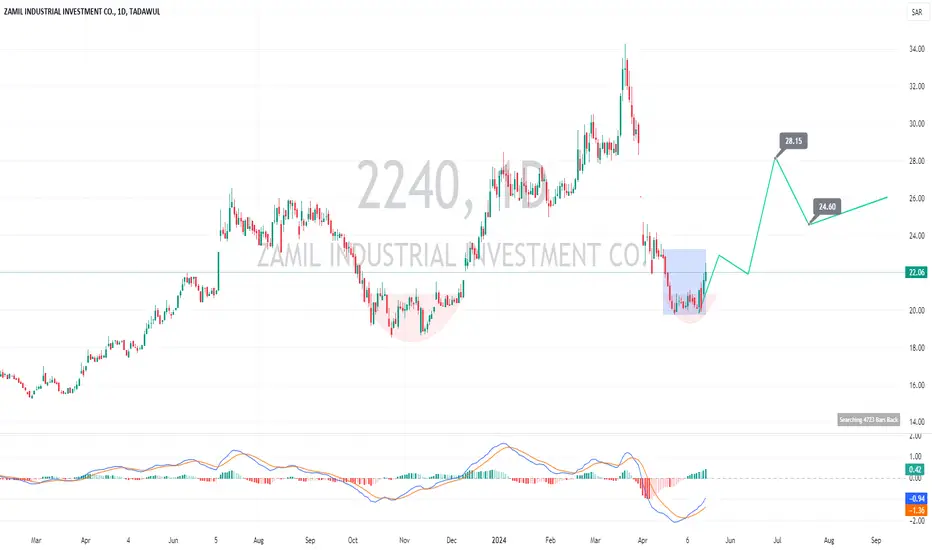
2240The price action is currently pulled back after making support of 20 level. Moreover, MACD indicator is trading below the zero line is cross over is observed. The pattern indicates bullish reversal. Initial resistance level lies around 24.60 and secondary resistance lies around 28.15. Use stop loss below the support level of 20 if it breaks
SAUDI ARAMCO to buy confidentlyTADAWUL:2222 gave a high quality signal .
In fact it just closed above a decisive area . And so TADAWUL:2222 has a high probability to continue up towards the 45 level .
Stay tuned for possible updates .
Requests , suggestions and remarks are all welcomed .

Big move ahead for SAUDI ARAMCO TADAWUL:2222 entered a key level .
If it succeeds to break well above it ,it is very likely to go significantly up .
I will be posting further details in case of confirmation .

DON'T BUY 1120On 1120 as you can see on the chart, the market came up to fill the imbalance we had and now it's continuing its way down towards the level 71.2.
Don't waste your money on stocks that are obviously going down, there are other stocks in which you still can put your money in and come with profits.
The comment section is all yours for further questions!

DON'T BUY 7010I got asked too many times about 7010 if there's a possibility to buy it, as I recieved many messages from people who have bought in the wrong timing.
As you can see on the chart, the structure of the market shows that it will keep pushing down toward the 34.90 level. which means there's no point of buying it currently and risk your money. Instead you can buy on the other markets in which you got good opportunities.
For further questions, don't hesitate to ask!
