Make it or Break it Situation!
22 - 24 is an Important level
that should be sustained don Weekly basis.
If 22 is broken, we may see a Trend Reversal.
On the flip side, if 24 - 24.40 is Sustained, we may
witness 26 initially.

ACWA Power CoA "gap-down" in finance refers to the situation where the price of a financial instrument opens significantly lower than its previous closing price. Like a gap-up, this can happen due to various factors such as negative news, disappointing earnings reports, or adverse market conditions, occurring outside of regular trading hours.
For traders and investors, a gap-down presents challenges and opportunities similar to a gap-up but in the opposite direction. Long positions may face losses, while short positions might gain. However, just as with a gap-up, there's uncertainty about whether the downward momentum will persist or reverse.
Traders often analyze the reasons behind the gap-down and consider factors such as trading volume, market sentiment, and technical indicators to make informed decisions about their positions. Risk management becomes crucial in such scenarios to mitigate potential losses.

SAUDI CHEMICAL COIn finance, a "gap up" refers to a scenario where the price of a financial instrument, such as a stock, commodity, or currency, opens significantly higher than its previous closing price. This often occurs due to positive news, earnings reports, or other market-moving events that occur outside of regular trading hours.
For traders and investors, a gap up can present both opportunities and risks. Those who are long on the asset may see immediate gains, while short sellers might face losses. However, there's always the uncertainty of whether the upward momentum will sustain throughout the trading day or if it will reverse.
It's important for traders to analyze the reasons behind the gap up and consider factors such as trading volume, market sentiment, and technical indicators to make informed decisions about whether to enter, exit, or hold their positions.

4013 dr sulaiman al habib4013 dr sulaiman al habib
falling agter buy stops.
target weekly imbalance mention on chart.

Golden Pocket Support.Last Week's Candle was actually
a Golden Pocket Support.
Plus, Bullish Divergence on Daily TF.
However 68 is a Very Strong Resistance.
Crossing & Sustaining 68.20 will lead to 72 - 73.
Stoploss in this case should be around 61.50

#TASI #CEMENT_Tabuk CementTabuk Cement still in the bearish trend in the monthly long term time frame and based on the continuation pattern and bearish flag formation, we remains bearish on the script. with possible further downwards movement toward the levels identified on the chart.

SAUDIA DAIRY AND FOODSTUFF COA "bullish Gartley" refers to a specific pattern that traders look for in financial markets, particularly in technical analysis, to potentially predict future price movements. It's named after its creator, H.M. Gartley, who introduced it in his book "Profits in the Stock Market" in 1935.
The bullish Gartley pattern is a harmonic pattern that consists of four distinct price swings or legs. These legs are labeled XA, AB, BC, and CD. The pattern typically forms after a significant downtrend and indicates a potential reversal to the upside.
Here's a breakdown of the legs of a bullish Gartley pattern:
1. XA: This is the initial leg of the pattern and represents the initial impulse move downward.
2. AB: After the XA leg, there is a retracement upward, forming the AB leg. This retracement should ideally reach a Fibonacci level of either 0.618 or 0.786 of the XA leg.
3. BC: Following the AB leg, there is another downward move forming the BC leg. This leg typically retraces 0.382 or 0.886 of the AB leg.
4. CD: Finally, the pattern completes with the CD leg, which is an extension of the BC leg. The CD leg should ideally reach the 1.272 or 1.618 Fibonacci extension of the BC leg.
When the CD leg completes near the Fibonacci extension levels, it suggests that the pattern is complete and a bullish reversal may occur. Traders often look for additional confirmation signals such as candlestick patterns, volume analysis, or other technical indicators before entering a trade based on the bullish Gartley pattern.
As with any technical analysis tool, it's important to remember that the bullish Gartley pattern is not foolproof and should be used in conjunction with other analysis methods and risk management strategies.

NAMA CHEMICALS CO.A "bullish butterfly" is a trading strategy used in the financial markets, particularly in options trading. It's a complex strategy that involves buying and selling multiple options contracts with the aim of profiting from a specific market outlook.
In a bullish butterfly, the trader expects the price of the underlying asset to increase moderately. The strategy typically involves buying one call option with a lower strike price, selling two call options with a higher strike price, and buying another call option with an even higher strike price. The options all have the same expiration date.
The payoff diagram of a bullish butterfly resembles the shape of a butterfly, with potential profit if the price of the underlying asset remains within a certain range upon expiration. The maximum profit is achieved if the price of the underlying asset is equal to the middle strike price at expiration, while the maximum loss is limited to the initial cost of setting up the strategy.
Traders may use a bullish butterfly when they anticipate a moderate increase in the price of the underlying asset, but with limited risk exposure. However, it's important to note that options trading can be complex and involves significant risks, so traders should thoroughly understand the strategy before implementing it.

AYYAN INVESTMENT COThe term "bullish crab" typically refers to a specific pattern in financial trading, specifically in technical analysis. It's a harmonic pattern that traders use to predict potential reversals in the price of an asset.
The bullish crab pattern is characterized by specific Fibonacci ratios between price swings. It consists of four price swings, with the second and third swings being retracements of the initial move. The key Fibonacci ratios involved are typically 38.2% and 88.6%.
Traders look for this pattern because, if it forms after a downtrend, it suggests that the asset's price might be poised for a bullish reversal. However, like all technical analysis tools, it's not foolproof and should be used in conjunction with other indicators and risk management strategies.

Methanol 2001 and Big Bull Run to begin!As you can see on the weekly chart,
I observe oversold conditions along with falling pattern that we are close to breaking through. Additionally, there is a divergence in the MACD.
Finally, I have also analyzed fractals.

1180: Buy ideaOn 1180 as you see on the chart we will have a big probability to have an uptrend if only if we have the breakout with force the vwap and the resistance line by a big green candle follow by a large green volume.Thanks!
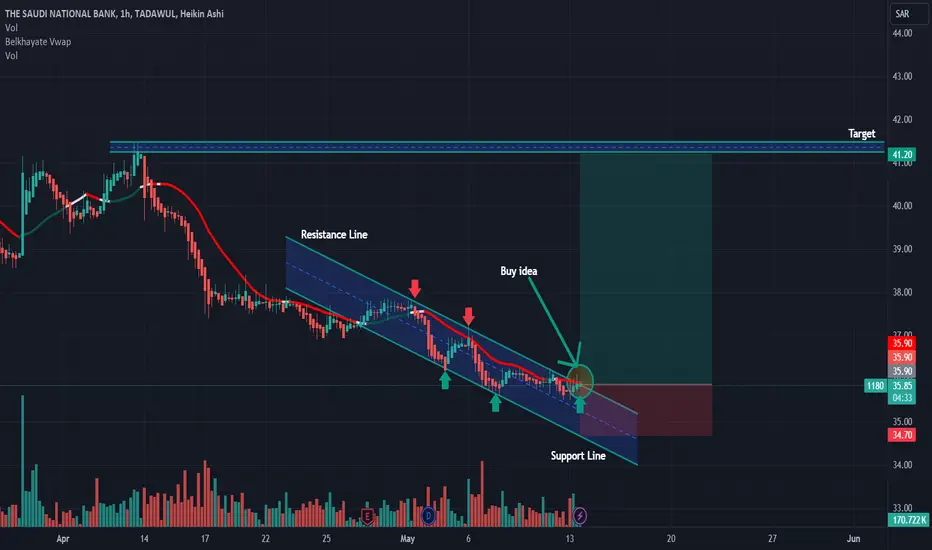
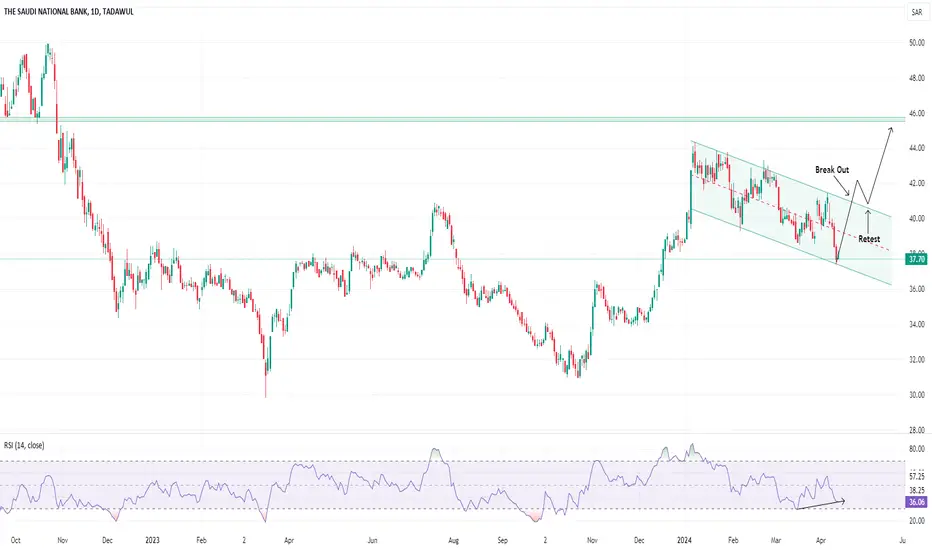
1180 | Flag Pattern & Bullish DivergenceSaudi National Bank displays a promising bullish reversal pattern characterized by the formation of bullish flag pattern and divergence with RSI. Our plan entails accumulating the stock within the designated buy zone (37.50-37.70 range), while setting stop loss orders below the bottom of support around 36. Anticipation builds for a substantial surge in momentum upon the test of the trend line, anticipated around the 40.90 area. To guide our trading decisions, we've delineated two distinct targets: an immediate target around 40.90 and a final target for exiting the trade will be around 45.50 depending upon break out.
2281: TanmiahThe Bullish Butterfly is a complex options trading strategy that aims to profit from a moderate rise in the price of the underlying asset. It's constructed using four options contracts with the same expiration date but different strike prices.
Here's how it typically works:
1. **Buying**:
- Buy one call option with a lower strike price (closest to the current market price).
- Buy one call option with a higher strike price.
2. **Selling**:
- Sell two call options with a strike price between the two bought options.
The key is that the sold options finance the purchase of the two options. This strategy is called a "butterfly" because if you graph the strike prices and profit/loss, it resembles a butterfly with wings.
The maximum profit is achieved if the underlying asset closes at the middle strike price at expiration. Maximum loss occurs if the price moves significantly beyond the higher or lower strike prices. This strategy is for traders who anticipate a moderate increase in the underlying asset's price with limited risk.

Bullish Divergence in JARIR after Bearish Butterfly patternBullish Divergence observed in JARIR after Bearish Butterfly (bearish harmonic reversal) pattern completion. As expected the Bearish Butterfly pattern reversed from point D (potential reversal zone) and created a bearish trend on a daily time frame. A bullish divergence is now observed and the trend will likely reverse and a bullish trend will likely start. If the bullish trend is confirmed, this can be a good point to take long positions.

8030THE MEDITERRANEAN AND GULF INSURANCE AND REINSURANCE CO.The bullish butterfly is another harmonic pattern in technical analysis, similar to the bearish bat pattern but indicating a potential bullish reversal instead. Like other harmonic patterns, it relies on Fibonacci ratios to identify potential entry and exit points in the market.
Here are the key features of a bullish butterfly pattern:
1. **Initial Move (XA)**: This is the first leg of the pattern, representing the initial impulse in price.
2. **Retracement (AB)**: Following the XA move, there is a retracement in price, typically falling within the range of 0.382 to 0.786 Fibonacci retracement of XA.
3. **Extension (BC)**: After the AB retracement, the price extends in the opposite direction, forming the BC leg. This move usually extends beyond the XA move, ranging from 1.618 to 2.618 Fibonacci extension of AB.
4. **Final Move (CD)**: Finally, the price retraces a significant portion of the BC move, forming the CD leg. This retracement typically ranges from 0.382 to 0.886 Fibonacci retracement of BC.
The bullish butterfly pattern suggests a potential reversal to the upside. Traders may look for buying opportunities when they identify this pattern, anticipating that the price will reverse its previous downtrend and start moving upwards.
As with any trading pattern, it's crucial to combine the bullish butterfly pattern with other technical analysis tools and risk management techniques to improve the probability of success in trading decisions.

8020MALATH COOPERATIVE INSURANCE CO.In financial trading, a "bearish bat" is a specific pattern identified within the field of technical analysis. It's considered a harmonic pattern, which means it's based on geometric price patterns found in the market.
The bearish bat pattern consists of four price moves, which form specific Fibonacci ratios. These moves are labeled XA, AB, BC, and CD. The pattern suggests potential bearish reversal opportunities. The main characteristics of a bearish bat pattern include:
1. **Initial Move (XA)**: This is the first move in the pattern, usually representing the initial impulse in price.
2. **Retracement (AB)**: After the initial move, the price retraces a certain percentage of the XA move. This retracement typically falls within the range of 0.382 to 0.50 Fibonacci retracement of XA.
3. **Extension (BC)**: Following the AB retracement, the price makes a move in the opposite direction, known as BC. This move typically extends beyond the XA move, usually by a ratio of 0.382 to 0.886 Fibonacci extension of AB.
4. **Final Move (CD)**: Finally, the price makes another move against the BC move, forming the CD leg. This move usually retraces a significant portion of the BC move, often ranging from 0.382 to 0.886 Fibonacci retracement of BC.
When all these moves align according to specific Fibonacci ratios, traders may identify a potential bearish reversal opportunity. However, as with any technical analysis pattern, it's essential to combine it with other forms of analysis and risk management techniques before making trading decisions.

Trade Wiselyas per analysis shared on 21-04-2024,
it touched 94.70 and went upto 102.
Now, it should Sustain 93 (on weekly basis).
In worst case, 88 can be seen as Bearish
Divergences are appearing on bigger
Time frames.
To Continue its Uptrend, it should Cross
& Sustain 106 - 107.
113 is a Very Strong Resistance.

Now again at 77.70 🙃
as mentioned if HH is not formed, even then it would touch 81-82 once.
on 08-05-2024, it made a High of 81.90
Now again at 77.70 🙃
Current Stance: We may look around 74 - 76 if it takes support...

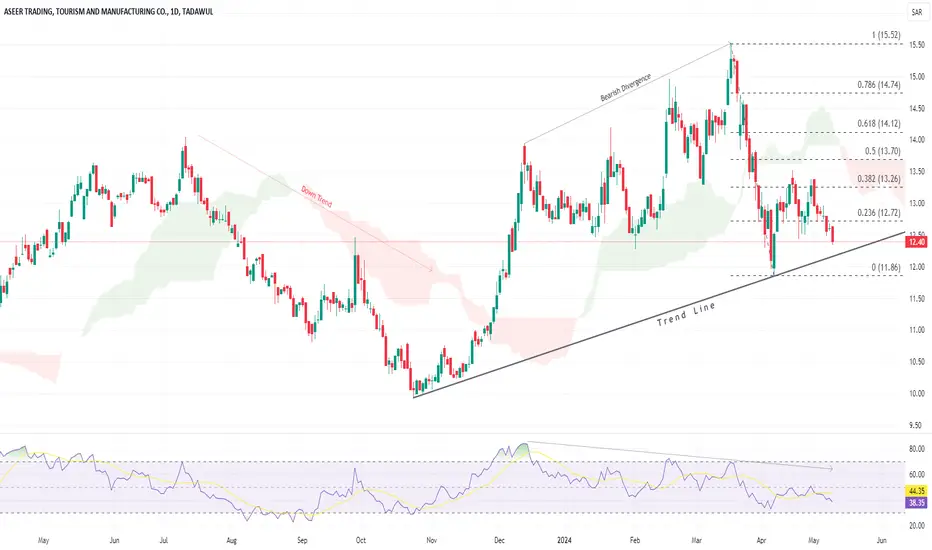
4080The price action is currently near the test of ascending trend line after got rejection from 15.52 level where bearish divergence with RSI is observed and closes at 12.40 in the last trading session. Upon sustaining the trend line support price can pull back towards its resistance levels of 13.50. If it breaks down ward then further bearish momentum can be seen.
Aseer Possible Scenario Aseer stock may retrace a little to complete w-4 before continuing its impulse wave. 12.42 is the upper price channel and also a confirmation. It either penetrates right away or retrace to the mid channel 11.36 but not more than that otherwise it cancels the whole analysis.

United Electronics Possible TargetsThe stock has retraced to complete W-4 at Fib 0.618 golden ratio. It is on the way to the fifth wave. Watch out for the upcoming resistance. Wave -5 could be a failure so when getting on the target just before that, it may some aggressive selling.
Everything I present here is for educational purposes, and it is not a recommendation for selling or buying.

Making HH HL on Weekly TFMaking HH HL on Weekly TF
but Bearish Divergence on Weekly Basis.
Either take entry once 86 is Sustained.
else, 72 Must be Sustained on Weekly as well
as Monthly Basis.
if 72 is broken, we may witness 63 - 65
However, on shorter time frame, Sustaining 75.30 may
lead it towards 79.

7202 | Arabian Internet And Communications Services CompanyArabian Internet And Communications Services Company displays a promising bullish pattern followed by ascending trend line. Moreover, the price is testing 200 EMA around 340 which can be consider for a long position, while setting stop loss orders below the bottom of support around 330. Initial target define around 360, upon sustaining this level secondary target would be 390.
