1322 AMAK D1 - 6/5/2024 (TASI Market)1322 AMAK D1 - 6/5/2024 (TASI Market):
Elliott Wave
Trend Analysis
Harmonic
Regards,

Making HH HL on Daily TF
Immediate Resistance is 4.25 and then 4.41
Breaking & Sustaining this level will lead it towards 5.30
initially


Americana to around 4The stock is preparing for a strong move up to above 4.. absorption completed .

ADES: Diamond pattern Breakout Diamond pattern with intense low volume trading just recently made a breakout

Cup & Handle FormationsEntry can be taken at CMP or around 59.50
with a Stoploss of 57 (closing basis)
However, more secure Stoploss would be 54.50
(on closing basis)
For Daily + Weekly Cup & Handle Targets,
Important level to Sustain is 62 - 64

Long
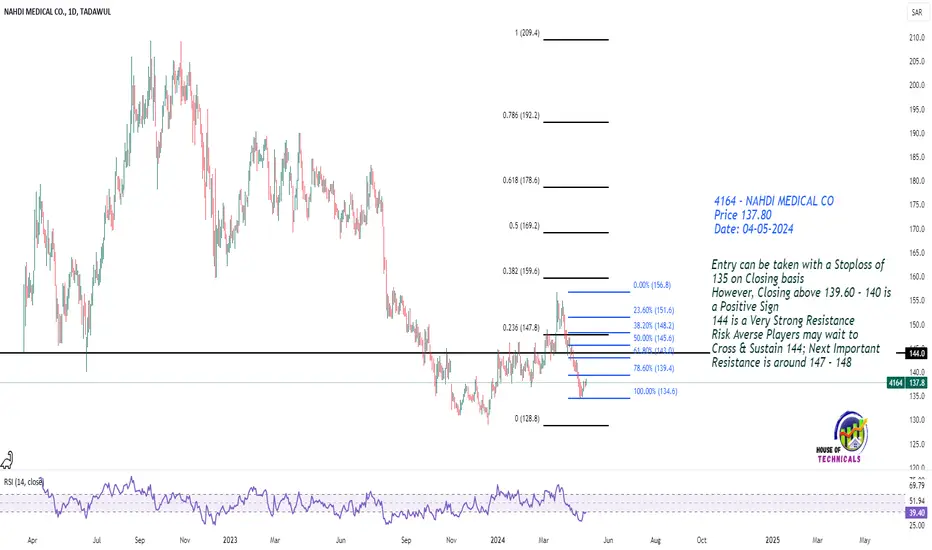
Entry can be taken with a Stoploss of
135 on Closing basis
However, Closing above 139.60 - 140 is
a Positive Sign
144 is a Very Strong Resistance
Risk Averse Players may wait to
Cross & Sustain 144; Next Important
Resistance is around 147 - 148
Bullish on Bigger Time Frames
However, Bearish Divergence is also
Observed on Weekly TF
ABCD pattern completes around 35 - 36 along-with
bearish divergence makes this level bit shaky at the
moment for new entrants.
32 - 33 Levels may act as Support but we Need
some Confirmation there.
However, Crossing & Sustain 36 would move it
Further Up; may be up to 39 initially & then 44 - 45

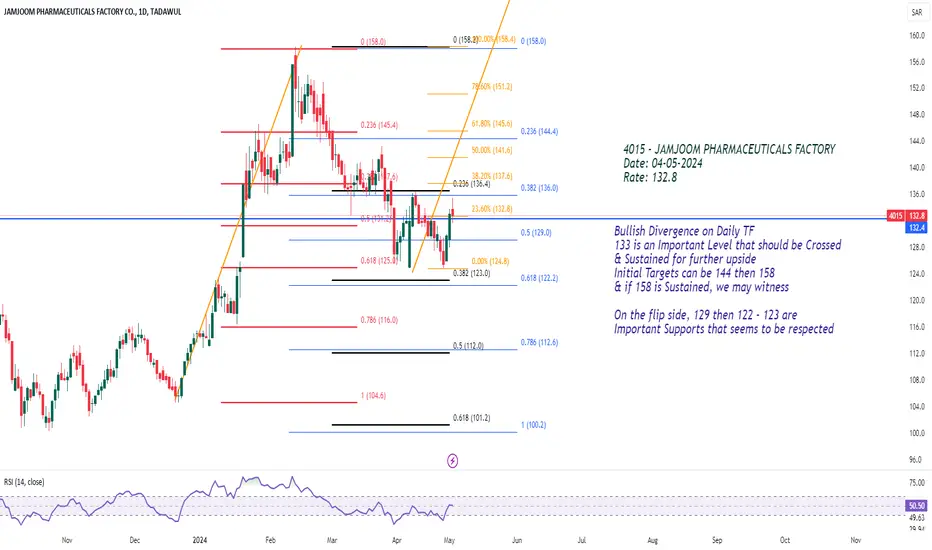
Bullish Divergence on Daily TF
133 is an Important Level that should be Crossed
& Sustained for further upside
Initial Targets can be 144 then 158
& if 158 is Sustained, we may witness
On the flip side, 129 then 122 - 123 are
Important Supports that seems to be respected
7203The price action is in uptrend making higher highs and higher lows and currently pulls back from 100 day EMA and currently testing 50 day EMA and closes at 942 in the last trading session. Initial resistance lies around 1,000 and secondary resistance lies around 1,120, upon breaching these levels the stock has potential to make more higher highs. Use stop loss below 910 to manage risk.

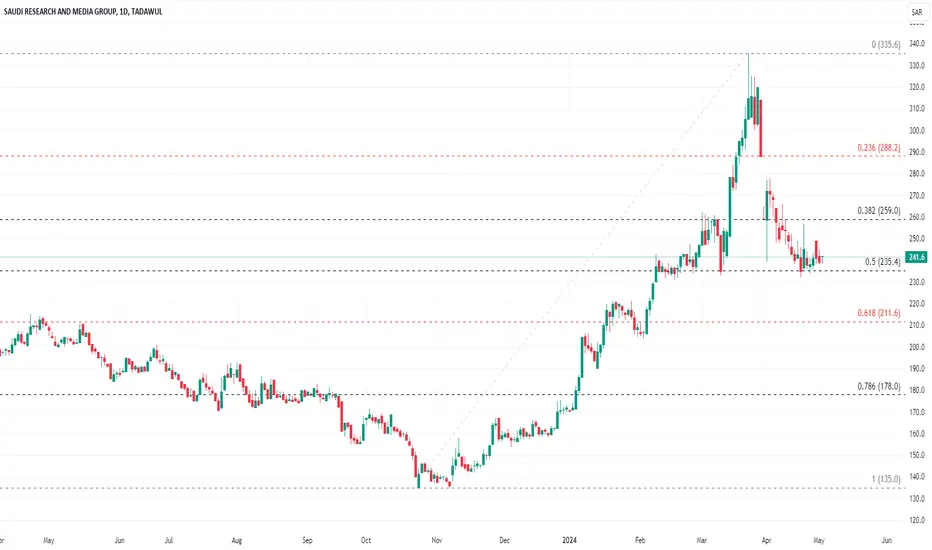
4210Saudi Research and Media Group displays a promising bullish reversal pattern, currently its sustaining its support level of 235 which is 50% Fibonacci retracement. Our plan entails accumulating the stock around 235, while setting stop loss orders if the support breaks to manage risk effectively. Initial resistance lies around 259 and secondary resistance lies around 288, upon breaching these levels the stock has potential to test previous high of 335.
1214: Breakout after CorrectionPrice took a correction and is taking support from golden pocket
Breakout of Descending parallel channel is observed
Retest of breakout is expected after pullback from resistance line
Take entry for TP until trendline resistance
Another entry after breakout of trendline resistance

6070: Watch for BreakoutPrice is in downtrend but it took support from long term trendline support
Price is touching a resistance
Watch for breakout
A safe entry is after 53.3 resistance breakout
Trail SL after breakout

4031: Ascending Triangle PatternPrice is nicely moving within Ascending Triangle
Entry can be taken now (until triangle top for short gains
Trail SL once the price touch the resistance (triangle top)
Proper Entry will be taken once the triangle breakout is observed
Trail SL below Triangle Top and ride the trend

1304: Yamama Steel (Series of HH, HL; Dow Theory)Series of HH, HL
Price has just crossed recent resistance (short term) and touching another resistance level
Buy above resistance, keep SL intact at the levels
Trail your SL accordingly
Manage your risk properly

4015_Possible Trend reversal (Bullish setup)4015
**Bullish Points:**
Price at significant support level (Volume profile) confluence with 78% fib level
Bullish divergence is observed
Small entry can be taken now (Aggressive)
Further entry can be taken after descending channel breakout, or
at next support level 118.6 (DCA strategy)
**Bearish Points:**
Price is moving in downtrend, series of LH/LL
H&S pattern breakdown and retest of neckline
Current stop loss is specified
Trail stop loss if price goes up
Place SL below 118 (DCA strategy)

1111: Consolidation (Short term and Long Term Bullish Setup)1111 took an upside movement and is in consolidation recently
Short term trade of 5 to 6% can be taken between SL and TP
Long term trade shall be taken after breakout of consolidation
Trade with proper risk management
Trail SL to ride the trend

2100: Morning star, Inv. H&S (Potential Bullish Setup)Price is taking correction
Inverted Head and Shoulder Pattern formation in process
Take entry after Breakout of Neckline
Morning Star formation at support line
Entry after breakout and retest
Trade with proper SL

2281: Potential Bullish Setup (Golden Pocket)Tanmiah earlier broke ATH and took correction
Price is moving in descending channel, however,
price has reached a significant support level
golden pocket (fib level) confluence
breakout will be bullish flag formation
Morning star formation at support level is positive for bullish trend after correction
Entry at current price or after breakout of channel (confirmation of HH and HL)
SL below Morning previous HL
Ride the trend with trailing SL

East Pipes: Trendline support; morning star (Bullish Setup)Price is moving in uptrend and recently take a correction
Price started forming HH, HL again after taking support from golden pocket
Trendline resistance breakout and retest is observed
Morning star formation at Trendline support confluence a bullish potential
Take entry with SL below 140 (aggressive), 131 (conservative)
Trail SL and enjoy the ride

4263: Dow Theory (Bullish Setup)Bullish Points
formation of HH, HL
Breakout of trendline resistance and retest
Reversal from fib level (golden pocket)
Entry can be taken now
SL is specified
Trail SL and ride the trend

Aramco & dream of 60 Hy all,
perhaps in the coming days I will stop posting for personal reasons
so if you're going to miss me I'll be around for a while on the X app hehe
anyway, today we have a dream with Aramco
for a lot of time we were waiting for Aramco at higher prices
so maybe this is our chance to go ahead and make the dream come true

92.60 is a Hurdle for nowa Bullish Pin Bar at a Trendline Support
is actually a Positive Sign favoring Bulls
Double Bottom Formation is around 86
that seems less likely to hit due to the
formation of a Morning Star on Daily Basis
However, 92.60 is a Hurdle for now
Entry can be taken at CMP or around 90
with a Stoploss of 85 (on Closing basis)
Initial Target to be around 95 - 96 &
then 99 - 100
